
Transforming UX with Data: Leveraging Adobe Analytics to Uncover Scroll Depth and Page Depth Insights
Problem Statement :
- Business stakeholders must assess whether users are genuinely engaging with their ads by monitoring scroll depth.
- By analyzing this data, we can strategically optimize ad placement, ensuring they are positioned at high-engagement points rather than too far down the page, where users may not reach.
- Ads should be strategically placed in areas where user scroll behavior indicates they are most likely to be seen, enhancing visibility and engagement.
User engagement on a website involves much more than just tracking basic metrics like page views and visitors. While these provide a general sense of traffic, they don’t fully capture how users interact with the content. Two critical yet often overlooked metrics that offer deeper insights into user engagement are page depth and scroll depth.
Page depth refers to how many pages a user navigates through during their session. It helps measure the overall engagement with the site’s content. The more pages a visitor views, the more engaged they likely are with the website’s offerings. This metric is particularly useful for understanding user interest and the effectiveness of internal linking, as it shows whether users are exploring various sections or simply leaving after viewing a single page.
How this metric is calculated
The initial page in a visit has a page depth of 0. The subsequent page has a page depth of 1, and this value increases with each additional page view throughout the visit. This metric only increments with page view (s.t()) calls, not with link tracking (s.tl()) calls.
Example : If a user lands on any page of any website, say Page A
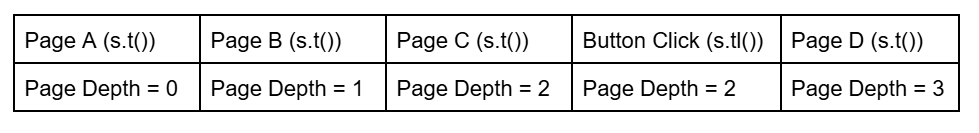
Page Depth Calculation
Scroll depth, on the other hand, measures how much a user is viewing the page content usually captured in percentage. This functionality provides insights user engagement with the page content. A high percentage of scroll depth indicates that the users are engaging with the content exhaustively, whereas a low percentage indicates that visitors’ behaviour around the webpage may be they are bouncing off the page before reaching the informative parts of the page.
How this metric is calculated
To calculate this metric, we will be defining page percentage viewed milestones as follows:
If a user views a page between 0% and 25% (i.e., >=0% and <=25%), we will consider it a "25% page viewed" milestone.
If a user views a page between 26% and 50% (i.e., >=26% and <=50%), we will consider it a "50% page viewed" milestone.
If a user views a page between 51% and 75% (i.e., >=51% and <=75%), we will consider it a "75% page viewed" milestone.
If a user views a page between 76% and 100% (i.e., >=76% and <=100%), we will consider it a "100% page viewed" milestone.
Though there are many other formats to capture percentage scroll bands. Some of which are mentioned below
Example:
[0% to 10%] and [10% to 20%] …………………….. [80% to 90%] and [90% to 100%]
[0% - 10%] and [10% - 20%] …………………….. [80% - 90%] and [90% - 100%]
[0% to 25%] and [25% to 50%] and [50% to 75%] and [75% to 100%]
[0% - 25%] and [25% - 50%] and [50% - 75%] and [75% - 100%]
[Less than 25% viewed] and [Less than 50% viewed] and [Less than 75% viewed] and [Less than 100% viewed]
Note: The determination of milestone ranges/bands and formatting is entirely up to you or based on your specific business requirements.
Collectively, these metrics provide a holistic view of user engagement with content, offering valuable insights to refine strategies for enhancing user experience, design, and content positioning on the website.
Let’s explore this further with a solution applicable for both Appmeasurement and WebSDK implementation and incorporate Scroll Depth into our current solution.
Step 1: We need to create a Data Element called “getPagePercentViewed” Below is the code for this.
Note: I use camel casing in naming conventions, as it’s recommended by Adobe and enhances readability.
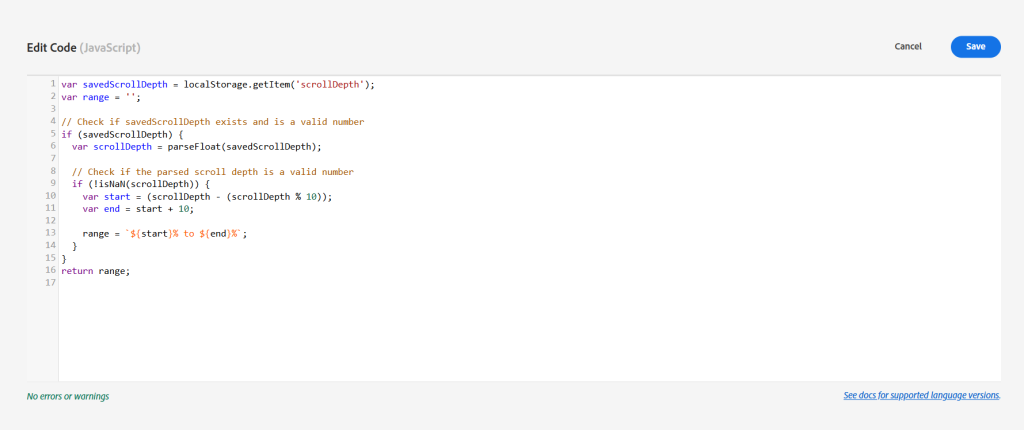
“getPagePercentViewed” – Data Element
Note : Feel free to use the switch case in case of code simplicity.
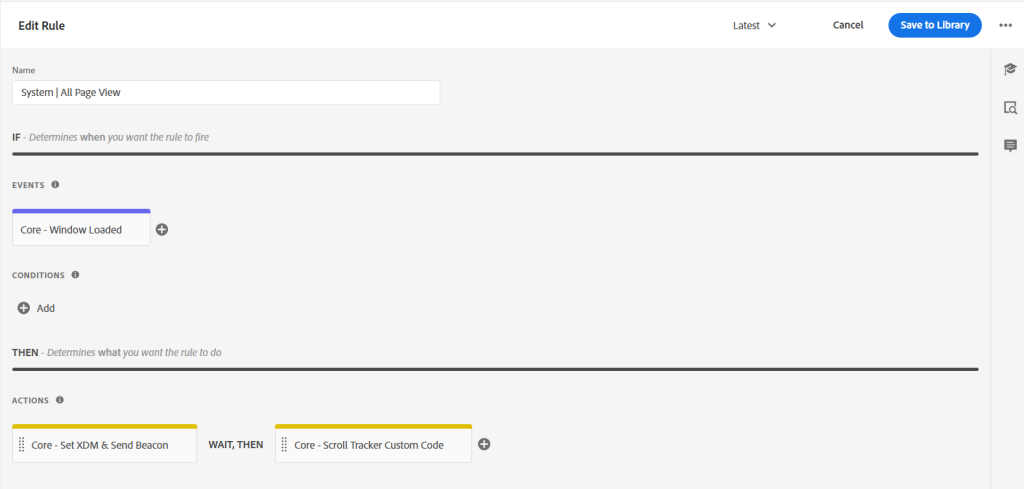
Step 2 : Now, we need to create a page view rule “System | All Page View”, below are the screenshots for reference
A) If you’re using appmeasurement implementation :
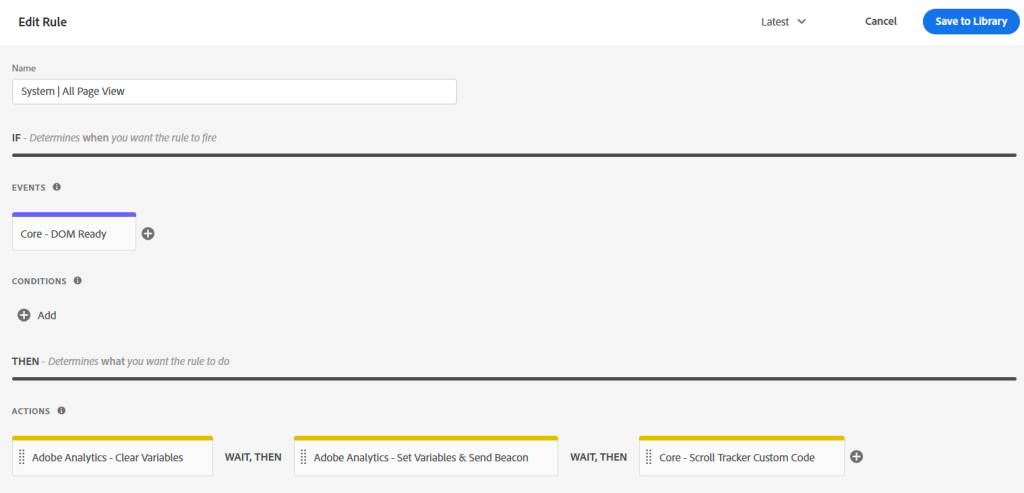
In the “Actions” Tab, first we’re using the “Clear Variables” function, then “Set Variables” and “Send Beacon” using custom code.
Below is the custom code for reference :
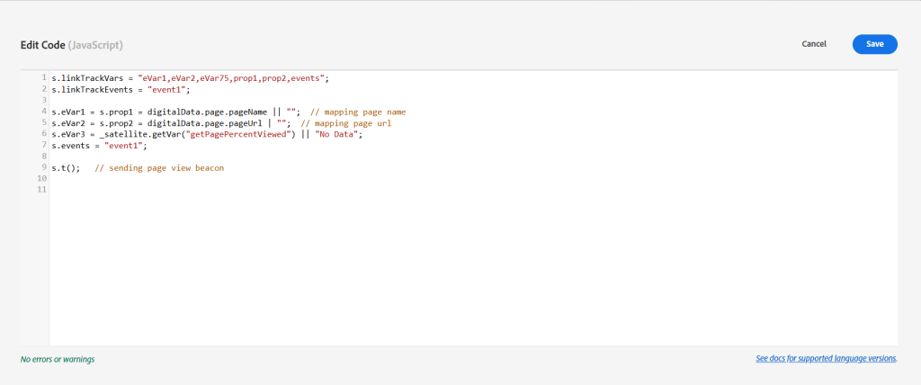
“Set Variables & Send Beacon”
Note : You can define separate data elements for ‘Page Name‘ and ‘Page URL‘ and then reference them within the custom code provided above. This method promotes code reusability and avoids redundancy. Since I’m utilizing a single rule, I’m directly mapping the values from the data layer.
B) If you’re using WebSDK implementation and using custom code :
“System | All Page View” – Rule using custom code
Below is the custom code for “Core – Set XDM & Send Beacon” :
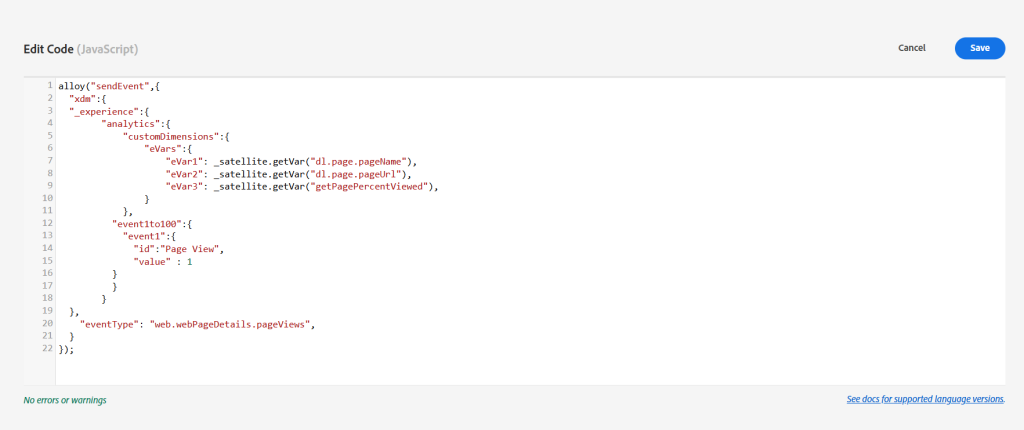
“Core – Set XDM & Send Beacon”
Note: “pageName” and “pageURL” are data elements that are fetching values from the dataLayer.
C) If you’re using WebSDK implementation and using UI mapping :
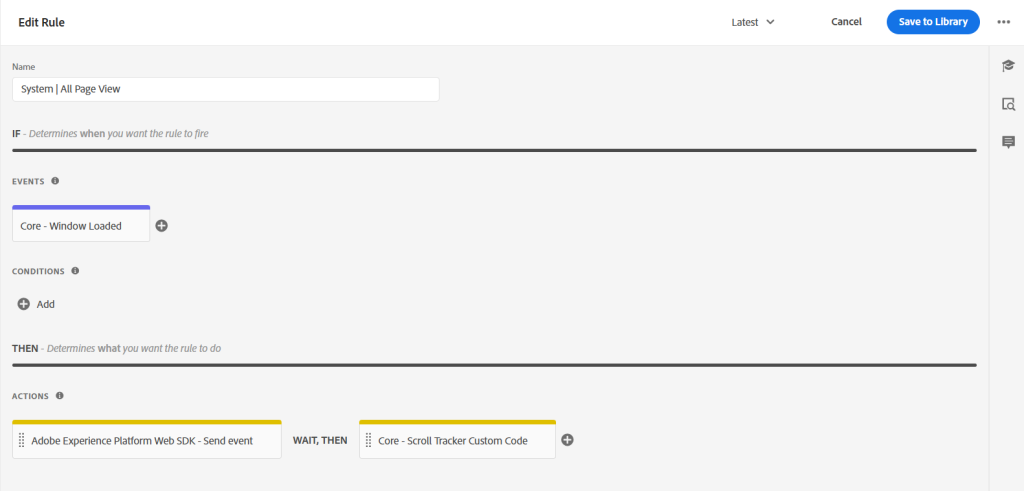
“System | All Page View” Rule
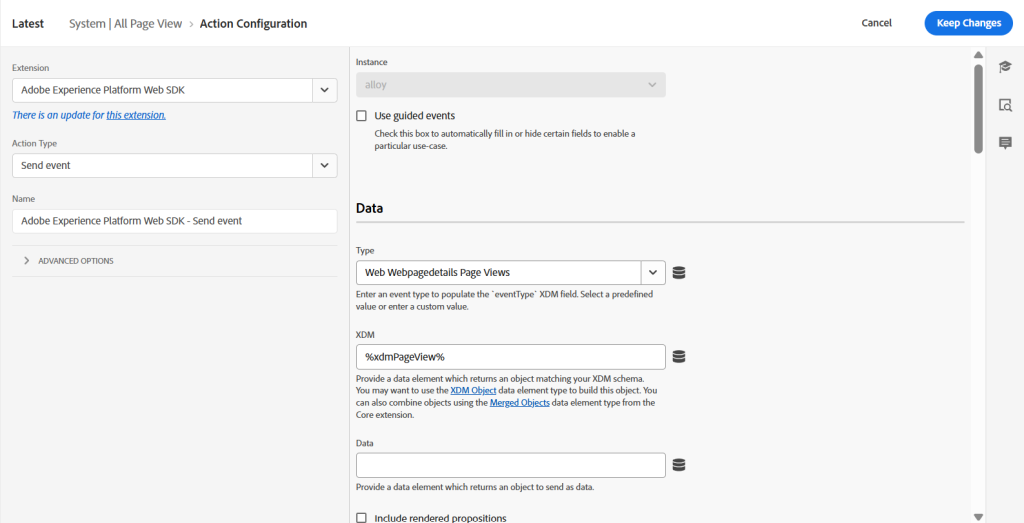
WebSDK- Send Event
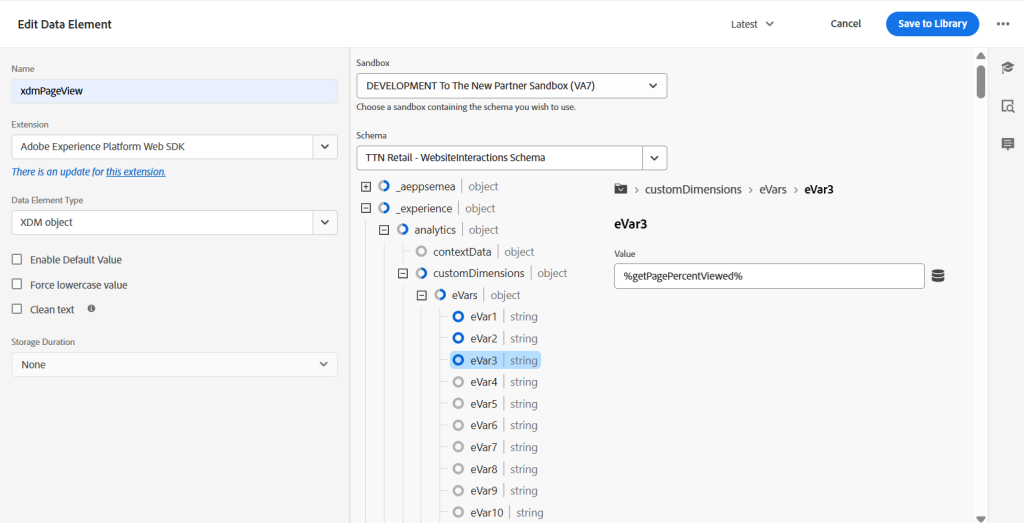
“xdmPageView” – XDM Data Element
Step 3 : Below is the code for the “Core – Scroll Tracker Custom Code” :
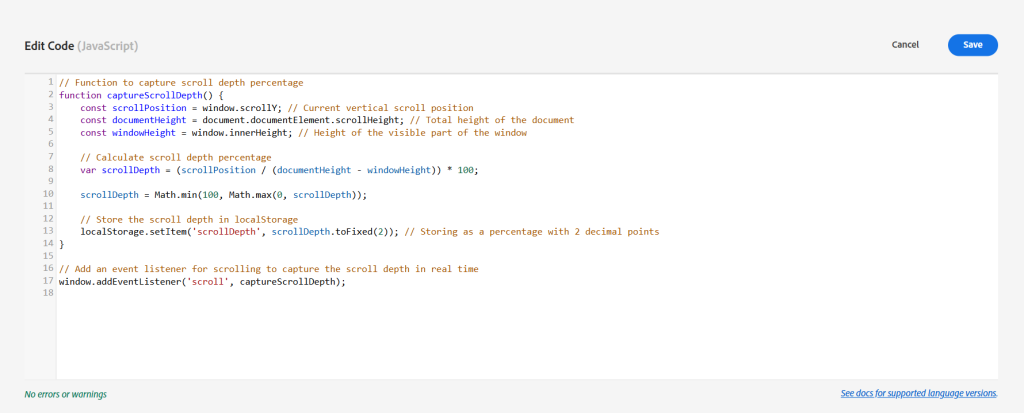
“Core – Scroll Tracker Custom Code”
Now, save all the changes in your library and build.
Boom, You’re all set up!
Now, access the “Network” tab and apply a filter to the analytics calls based on your implementation. If leveraging AppMeasurement or the Adobe Analytics Extension, filter by [b/ss]. Conversely, if employing the WebSDK or the AEP Web SDK Extension, filter by [interact].
The scroll percentage will be reflected in eVar3/v3 as “40% to 50%” or “70% to 80%.” For the purposes of this example, we are utilizing a 10% range.
This methodology enables the capture of the scroll depth from the preceding page. Specifically, it tracks the extent of scrolling on Page A prior to navigating to Page B via a link. Hence, we’re recommending to use “previousPageName” or/and “previousPageURL” data elements, which capture the URL and name of the previous viewed page [say Page A] in eVar4 and eVar5, respectively, for data visualisation.
Drawbacks, but not really:
- The scroll percentage cannot be captured if a user accesses the homepage, scrolls, and subsequently exits.
- Similarly, it is not possible to record the scroll percentage of the final page the user interacted with before leaving the site.
What is Same-Page Scroll Percentage Tracking?
Same-page scroll percentage tracking refers to the practice where, upon a user landing on the homepage (or Page A, the first page of the site), every time a predefined scroll milestone is reached, a network beacon is triggered.
For example, if a user scrolls down to 68% of the homepage, a total of 6 beacons would be fired. These milestones are defined as:
Beacon 1: 0% to 10% of the page viewed
Beacon 2: 10% to 20% of the page viewed
Beacon 3: 20% to 30% of the page viewed
Beacon 4: 30% to 40% of the page viewed
Beacon 5: 50% to 60% of the page viewed
Beacon 6: 60% to 70% of the page viewed
After the user exits the website, we’ll record six distinct hits for the user with ECID ABCD1234.
The Problem: “Bounces” and “Bounce Rate”
Here’s where things go wrong: these repeated scroll-triggered beacons impact the way “bounces” are calculated. The bounce rate metric is typically used to measure the number of sessions that include only a single interaction (i.e., one hit). Ideally, if a user lands on the homepage and doesn’t interact further (no additional page loads or link clicks), that visit would be counted as a “bounce.”
However, due to the implementation of same-page scroll tracking, the user is generating multiple hits while still on the homepage. As a result, this visit will not be classified as a “bounce,” even though the user didn’t navigate beyond the initial page. This misreporting leads to inaccurate bounce rate data and affects the integrity of the bounce metric.
For a more detailed explanation of how Bounces and Bounce Rate are calculated, please refer to Adobe’s documentation.
Feel free to reach out to us for Adobe Analytics Consulting Services!
Happy Learning!
