One-click setup!
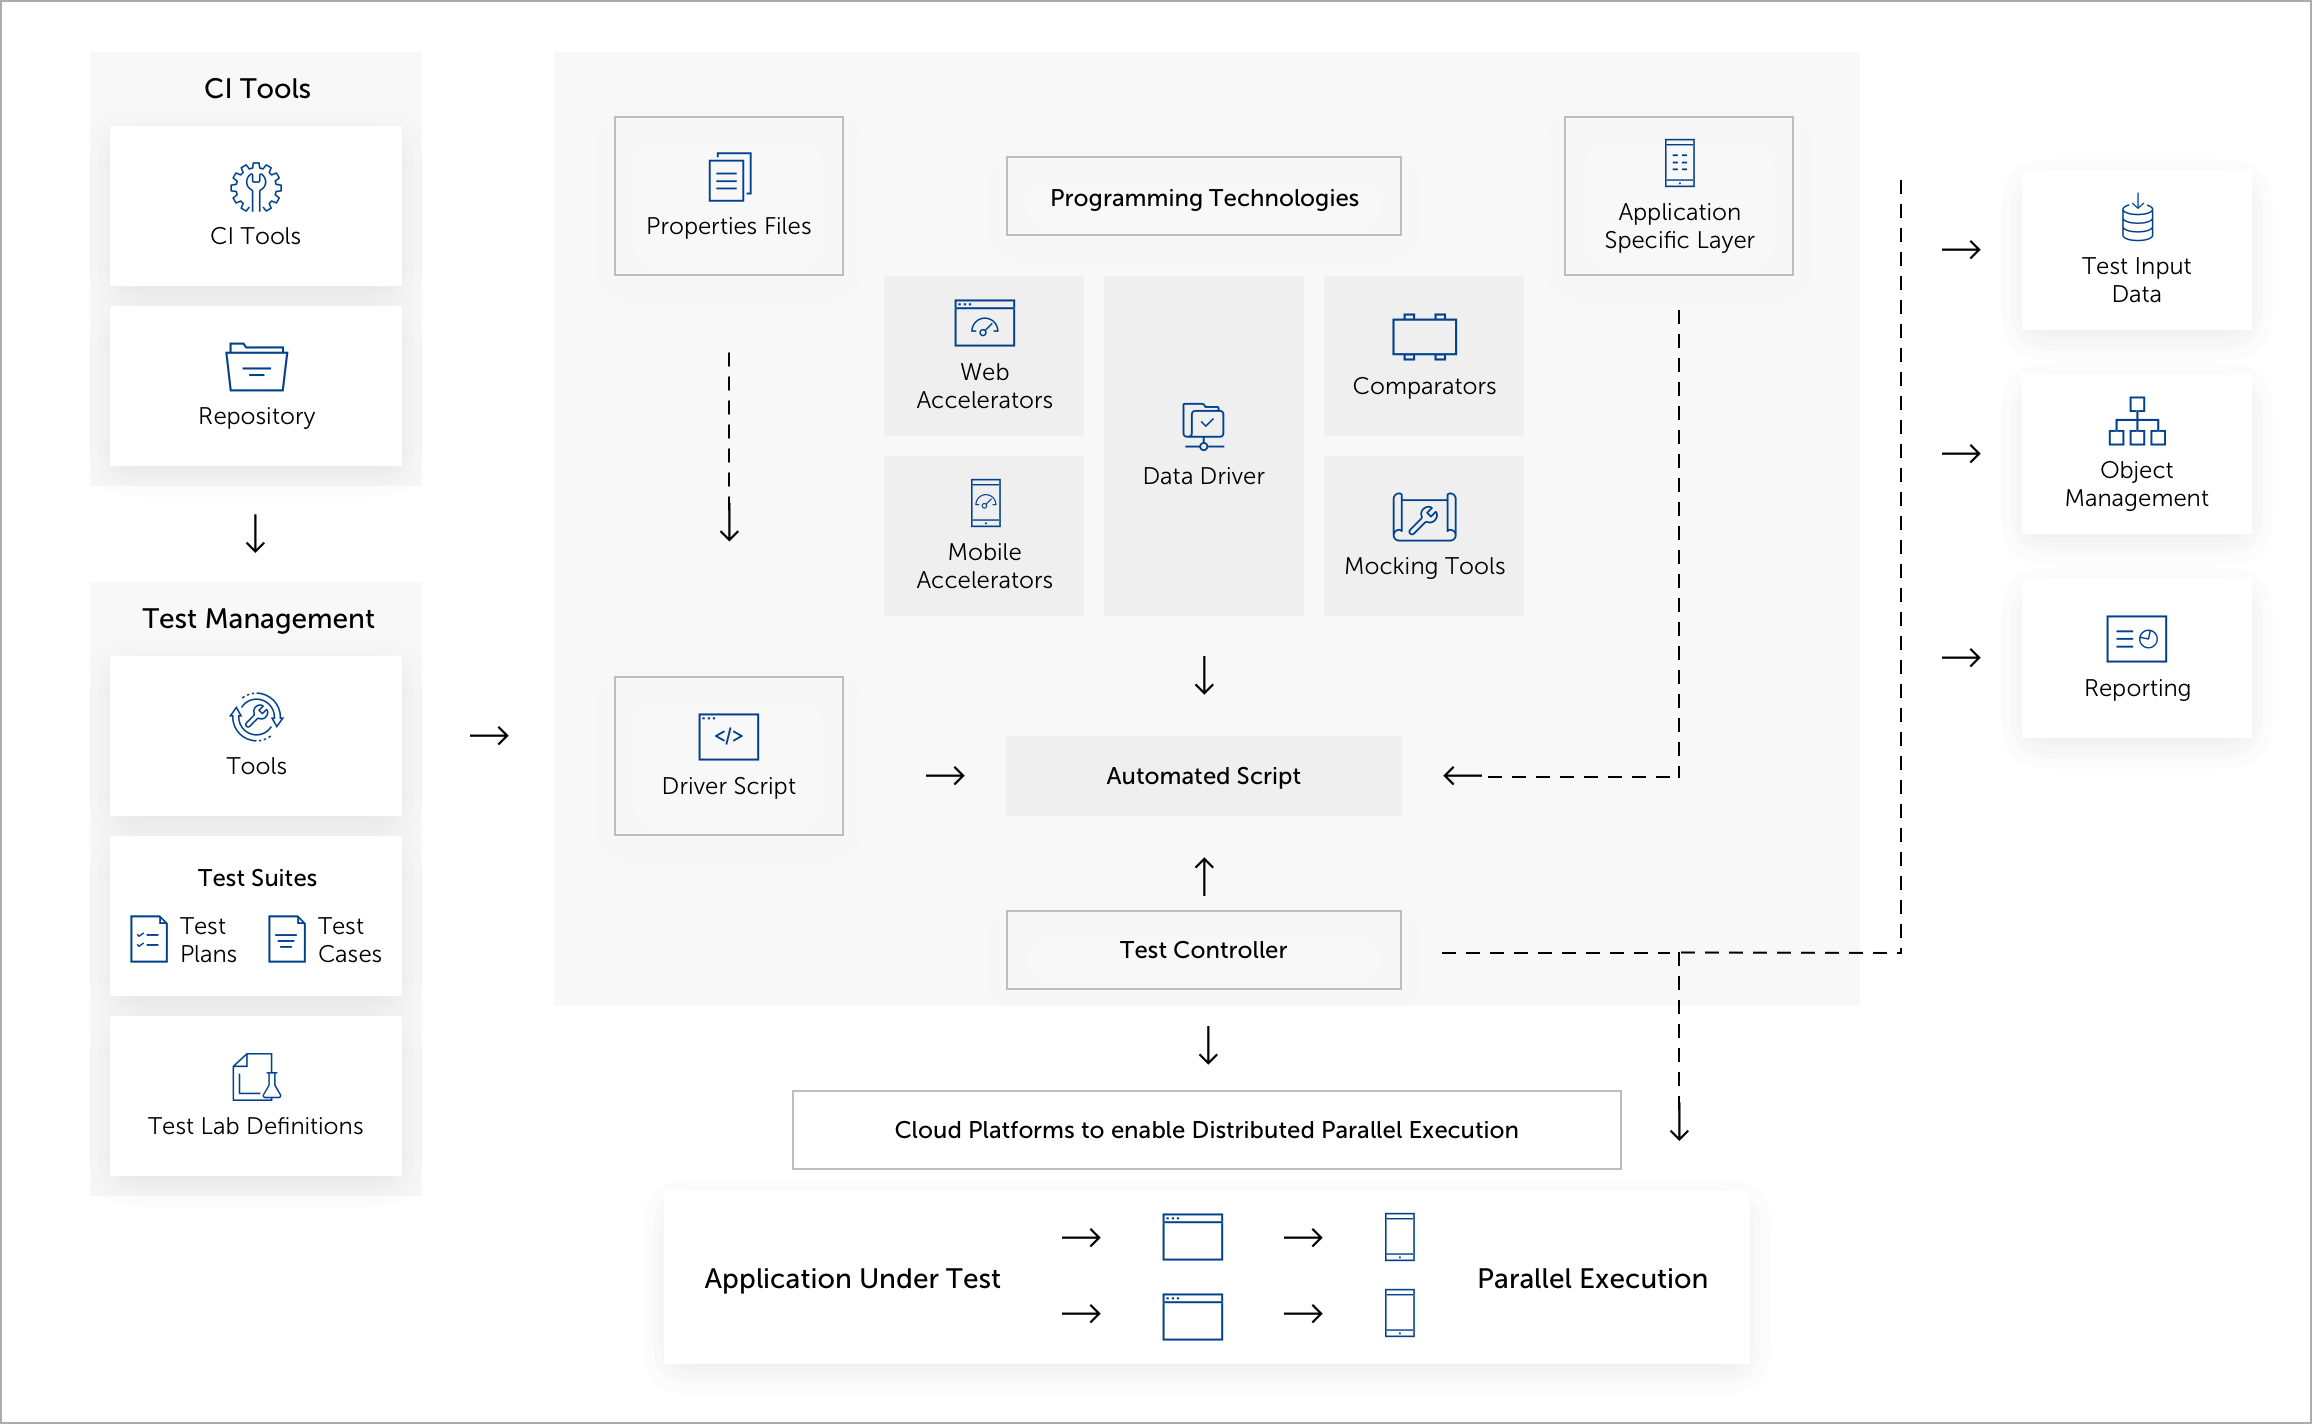
The simple web-based Prism interface assists in choosing the framework of choice with great ease. One-click setup with the required integrations for the corresponding automation suite.
Real-Time Execution View
The centralized dashboard shows the execution status of the parallel runs in real-time. It offers the flexibility to run tests from the local machine, across multiple platforms, browsers, or devices/emulators & simulators.
Unified Test Reporting
The AI/ML-powered dashboard provides detailed analysis, important insights, and fast feedback with less noise - all in one place. 20+ reporting widgets are available to slice and dice all present as well as historical test execution data and offer a customized dashboard.
Cross-platform Test Coverage
The insightful reporting analytics provides test coverage across multiple platforms, browsers & devices. The data can be seen for individual launches (e.g current build) as well as collectively for all the launches in a sprint.
Analysis Efforts Optimized
The Machine Learning (ML) powered algorithm filters out false failures and helps to focus on real product bugs. With the Auto Analysis, Pattern Analysis & Error Bucketing features in place can reduce analysis efforts by ~90% reduction in analysis efforts. Visual Analytics is available for Launch Statistics, Failure Trends, Bug Categories, and Log Exceptions. Issues can be logged with a single click, along with the required information like screenshots & comments.
Flaky Tests & Preventive Measures
See the patterns of Test failures from the historical data and take preventive measures to increase the pass percentage in subsequent launches.
Integrates well with other popular Open-source Tools & Frameworks used for Web Application Testing, Native Application Testing, Automation Testing, Behavior-driven Development, Continuous Integration & Test Management, and Agile Project Management
Reduces analysis efforts by up to ~90% with the help of Auto Analysis, Pattern Analysis, & Error Bucketing and keeps the script maintenance low by using Page Object Model & Page Factory Design patterns
Uses an AI/ML-powered Reporting Dashboard to provide detailed reports, important insights & fast feedback with Visual Analytics on Launch Statistics, Coverage, Failure Trends, Bug Categories & Log Exceptions


