
Optimizing Application Performance with Datadog Continuous Profiler
Introduction
Modern applications behave quite differently in production compared to development or testing environments. Outlier requests and accounts, edge cases, configuration changes, security features, and request spikes can make an application behave in unexpected ways. This may lead to poor CPU and memory performance, which can be costly and result in an undesirable end-user experience. Datadog Continuous Profiler enables you to quickly uncover costly bugs and identify code improvements to help you reduce infrastructure costs and enhance end-user experience.
Objective
By the end of this blog, you’ll be able to do the following:
- Determine when and how to use continuous profiling for diagnosing application performance problems.
- Apply a performance diagnostic methodology to troubleshoot code performance issues using profile types, endpoint profiling, and comparing profiles in Continuous Profiler.
Continuous Code Profiling
- Continuous code profiling allows you to measure code performance at all times in any environment.
- In production, an application process is mostly a closed box. You can observe external behaviors but not internal ones. Profiling is a way to look inside the box, observe these internal behaviors, and measure the application’s code performance. You can detect and optimize the most time-consuming and resource-intensive lines of code that affect costs and end-user experience.
- Profiling becomes much more effective when done in production because it’s usually difficult and time-consuming to simulate production behavior or reproduce specific bottlenecks and outages in non-production environments.
Continuous profiling in Datadog
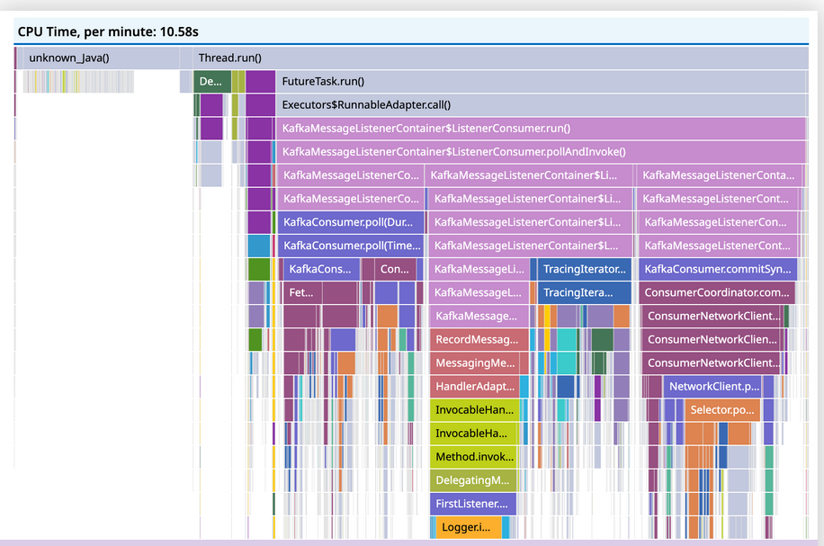
Example of a CPU Time profiler flame graph in Continuous Profiler.
Datadog Continuous Profiler is an always-on, production code profiler that enables you to analyze code-level performance across your entire environment, with minimal overhead. Profiles reveal which methods/functions consume the most resources, such as CPU, memory allocation, wall time, and I/O time spent. With this information, you can optimize your code to reduce end-user latency and cloud provider costs.
Continuous profiling in Datadog allows you to do the following:
- Perform code-level tracing with zero instrumentation
- Visualize all your stack traces in one place
- Discover bottlenecks in your code at a glance
- Filter profile data using tags
- Get actionable insights for performance improvements
Continuous Profiling Goes Beyond Distributed Tracing
Consider you have a service called movies-api-java that has multiple endpoints that return movie metadata stored in a database. You learn that the service isn’t performing well and users are experiencing increased latency issues. You want to optimize the service’s performance to ensure that users have the best experience.
You start using Datadog APM and distributed tracing to investigate the performance issues. For example, if you see additional spans in traces for unnecessary, repeated calls to a database when requests are made to an endpoint, you know you can use this information to determine a fix. However, for some issues, you see that you need to go beyond distributed tracing to be able to diagnose issues and optimize performance. In the example below, the trace shows that it takes over 2 seconds to respond to a request, but there are no child spans or other indicators that can tell you more about what may be causing the slow performance.
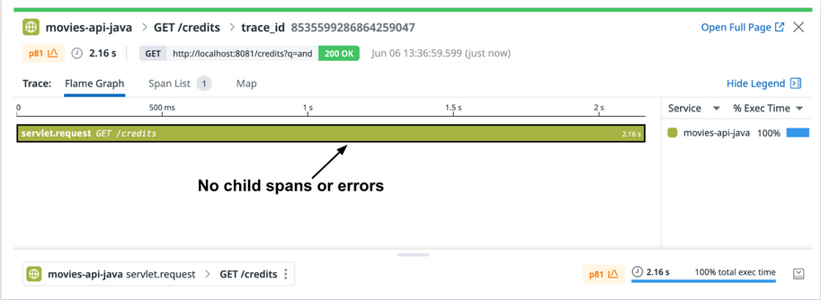
Example of a high-latency trace with no spans.
For issues that you can’t solve using APM, you can use Continuous Profiler to investigate at a more granular level. The difference between distributed tracing and continuous profiling is that traces tell you which requests were slow at the service level, whereas profiles tell you why they were slow at the code level.
Profiles
In Datadog, trace data and profiling data are automatically linked for application processes that have both APM and Continuous Profiler enabled. In the trace details panel in APM, you can move directly from the information for a trace or a selected span in a trace to the associated profiling data using the Profiles tab.
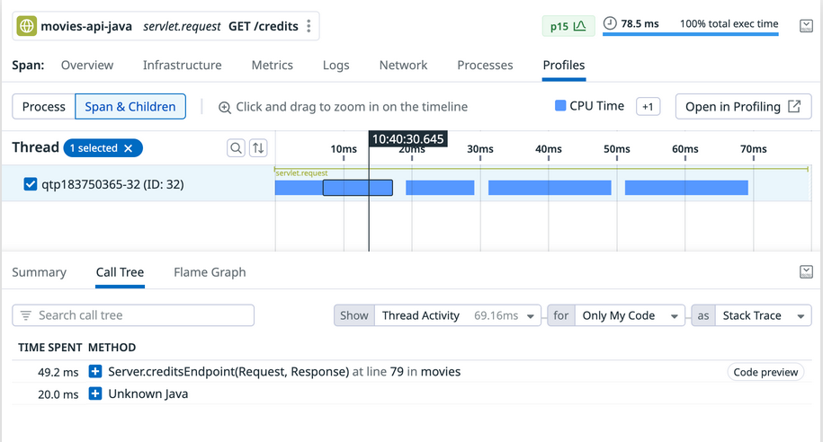
The Profiles UI found in the details panel for a trace.
Interpreting the Profiler Flame Graph
Similar to traces, profiles are represented in flame graphs. However, profiler flame graphs are interpreted differently because the data they represent is different. The profiler flame graph pictured below represents CPU Time by method.
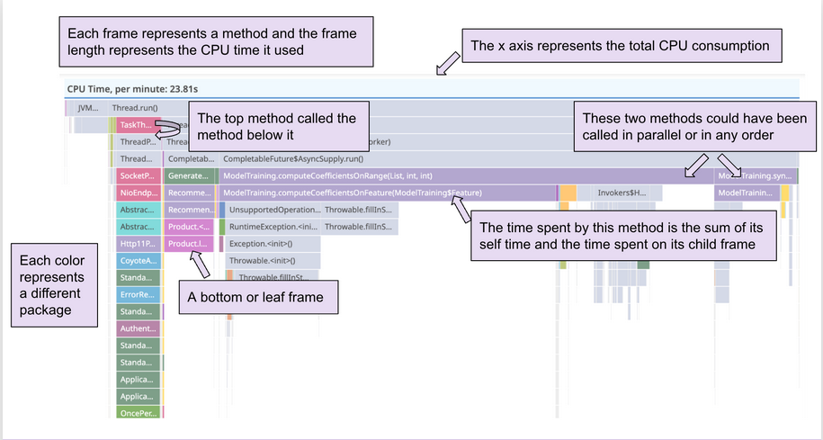
Profiler flame graph with important details explained.
- The x-axis represents the total CPU consumption.
- Each horizontal bar is a frame.
- Each frame represents a method. The frames are arranged from top to bottom, in the order that each method was called during a program’s execution.
- Each color represents a different package.
- The top frame defined here is usually called the “root frame” and its value is the sum of the child frames. Comparing it to a pie chart, the root frame is the total pie and each stack trace represents a different piece of the pie.
- The width of each frame corresponds to its resource consumption. The longer the frame, the more CPU Time was used.
- Two methods appearing side by side could have been called in parallel or in any order. Frames are ordered alphabetically from left to right.
- The bottom frame is called the leaf frame and represents the last method called in the stack. The leaf frame only represents its self time because it has no child frames.
Breaking Down Resource Consumption Using Profile Types
There are a variety of profile types that you can view in Continuous Profiler to help you understand and investigate different aspects of your code’s performance.
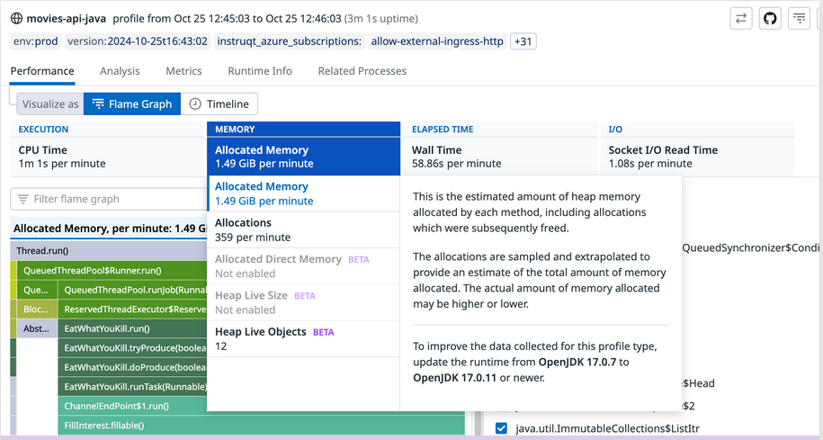
Example of available profile types based on the filtered profile data.
Understanding Profile Types and Resource Consumption
Each profile type represents a type of resource consumption, such as CPU, wall time, or memory. The profile types available for you to select may differ based on the language being profiled. The following are the most common profile types:
- CPU profiling measures which methods consume the most CPU on an application.
- Allocation profiling measures the amount of memory allocated by a given method.
- Heap profiling measures the amount of heap memory allocated by each function that hasn’t been garbage collected. This is useful for investigating the overall memory usage of your service and identifying potential memory leaks.
- Lock profiling measures the amount of time a thread is waiting to acquire a lock and is hence doing nothing.
- Wall Time profiling measures the effective time spent by methods. It can be useful to debug latency at first glance and then dig into the other profiling types to find out what was causing the latency. The wall time profile can be considered to be the most similar to the associated APM flame graph.
- File I/O and Socket I/O measure the number of time spent by methods on disk.
- Exceptions measure the amount of exceptions thrown. The profiler doesn’t catch/handle exceptions, but it tracks their creation.
Investigating Slow Endpoints with Endpoint Profiling
Endpoint profiling allows you to scope profiler flame graphs by any API endpoint of a service, so you can find endpoints that are slow and causing poor end-user experience. Debugging and understanding why an endpoint has high latency can be tricky. For example, high latency could be caused by a method that is CPU-heavy and unknowingly on the critical path of a request process where latency is important.
You can do the following with endpoint profiling:
- Identify the bottleneck methods that are slowing down the endpoint’s overall response time.
- Isolate the top endpoints that are responsible for consuming resources like CPU and memory. This is particularly helpful when you’re trying to optimize your service for performance gains.
- Understand if third-party code or runtime libraries are the reason for endpoints being slow or heavy on resource consumption.
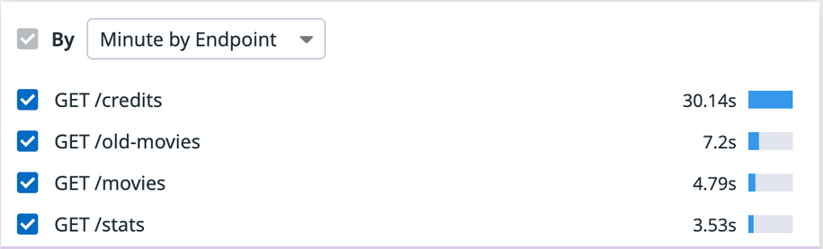
Example of list of endpoints that appears in the summary list for a profile.
In general, it’s valuable to track which endpoints are consuming the most valuable resources, such as CPU and memory. The list can help you identify if your endpoints have regressed or if you have newly introduced endpoints that are drastically consuming more resources than expected and slowing down your overall service.
Comparing Profiles to Gain More Insights into Code Performance
The Compare feature permits you to compare two profiles or profile aggregations. This can help you identify code performance improvements, regressions, and structural changes as you troubleshoot issues. For example, you can see if the service you’re profiling is taking more or less time, utilizing more or less memory, making more or fewer allocations, throwing more or fewer exceptions, or including more or less code and calls than it was in the past.
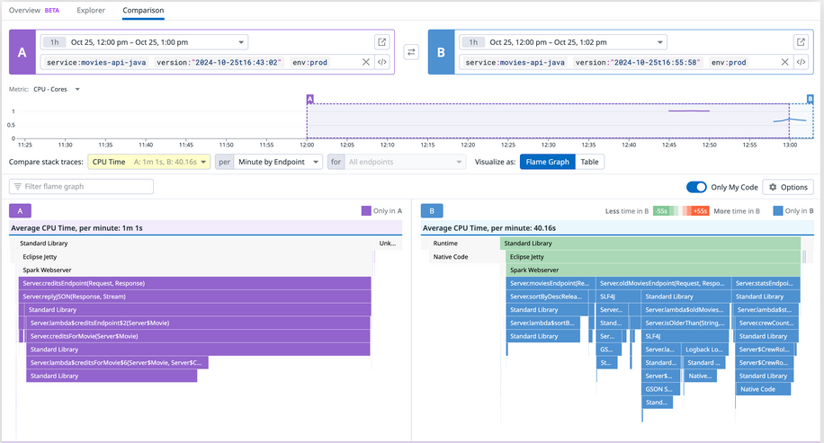
Screenshot of the comparison between two profiler flame graphs.
Conclusion
Continuous Profiler is a powerful tool that allows you to continuously profile your production code so that you can investigate and optimize its performance. You can discover and optimize inefficient parts of your code to improve resource consumption, cost savings, app performance, and end-user experience.
You’re now able to do the following:
- Determine when and how to use continuous profiling to diagnose application performance problems.
- Apply a performance diagnostic methodology to troubleshoot code performance issues using profile types, endpoint profiling, and comparing profiles in the Continuous Profiler.


