
Maximizing Log Visibility and Reducing Costs: Effective Strategies for Managing Indexed Log Volumes in Datadog
Introduction
Datadog Log Management offers powerful tools for querying, analyzing, and monitoring logs so that you have the details you need to track and investigate the performance, health, and security of your systems and applications. These logs sources can produce thousands of log events per minute, indexing all logs for querying, analytics, and monitoring can quickly become costly. One way to reduce these expenses is to filter logs before you ingest them into Datadog, thereby minimizing the volume of logs processed from the start. However, this can risk creating coverage gaps or accidentally discarding critical data, which you’ll want to avoid.
To overcome these limitations, Datadog offers Logging without Limits. This feature decouples log ingestion from indexing, allowing you to efficiently collect, process, archive, explore, analyze, and monitor all logs, without being constrained by high costs or the fear of losing valuable information.
In this blog, we’ll explore how to effectively manage and monitor log index volumes using Log Indexes, Exclusion Filters, Logs Monitors, and the Log Management – Estimated Usage dashboard in Datadog. These tools and techniques will help you optimize your log management processes and reduce costs.
End-to-End Log Management Process with Datadog’s Logging without Limits
Once logs are ingested and processed in Datadog, you can use tags and attributes to manage them effectively. This includes filtering logs to create insights, storing or discarding logs based on their importance, and indexing the logs you need on a daily basis. Additionally, you can manage retention and daily quotas to help reduce costs.
Below is the pathway for ingested logs in Datadog. (Note, that not all of these products/features will be enabled in every Datadog organization. Some of these features require activation and configuration.)
- Ingestion: Logs are ingested by Datadog.
- Preprocessing: Logs are then preprocessed (if they’re in the JSON format) and processed using Pipelines and Standard Attributes to parse attributes, enrich log details, and standardize attribute names across all logs.
- Sensitive Data Scanning: Logs are scanned for sensitive data using the Sensitive Data Scanner. Cloud SIEM detection rules are also implemented to detect threats and attacks.
- Error Tracking and Anomaly Detection: Error Tracking issues and Anomaly Detection Watchdog insights are created from logs for troubleshooting and monitoring.
- Live Tail: All ingested and processed logs can be searched in Live Tail.
- Metric Generation: Before indexing or storing logs, any set of logs can be used to Generate Metrics for analytics and monitoring.
- Indexing and Storage: Logs needed on-hand daily for facet-based searches can be indexed using Indexes. Logs needed ad-hoc occasionally can be assigned to Flex Tier. Unnecessary logs can be excluded using Exclusion Filters.
- Log Forwarding and Archiving: Important logs that aren’t needed daily but need to be retained for incidents can be forwarded to external archives (cloud storage) and custom destinations using Log Forwarding. These logs can be retrieved and indexed as needed by Rehydrating from Archives. Rehydrated logs are not affected by exclusion filters in indexes.
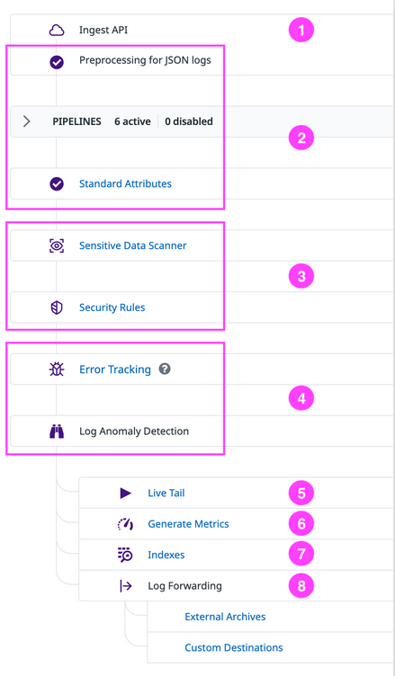
Logging without Limits log ingestion to indexing pathway.
Log Management – Estimated Usage Dashboard
Once logs are ingested into your Datadog account, the Log Management – Estimated Usage dashboard is automatically set up.
This built-in dashboard summarizes your log usage metrics including overviews for the following:
- Ingested, Indexed, and Excluded Log Volumes: Overview of the total volume of logs processed, indexed, or excluded.
- Log Processing Statistics: Metrics on how logs are processed by pipelines.
- Log Forwarding and Intake Volumes: Details on log forwarding activities and the volume of logs being ingested.
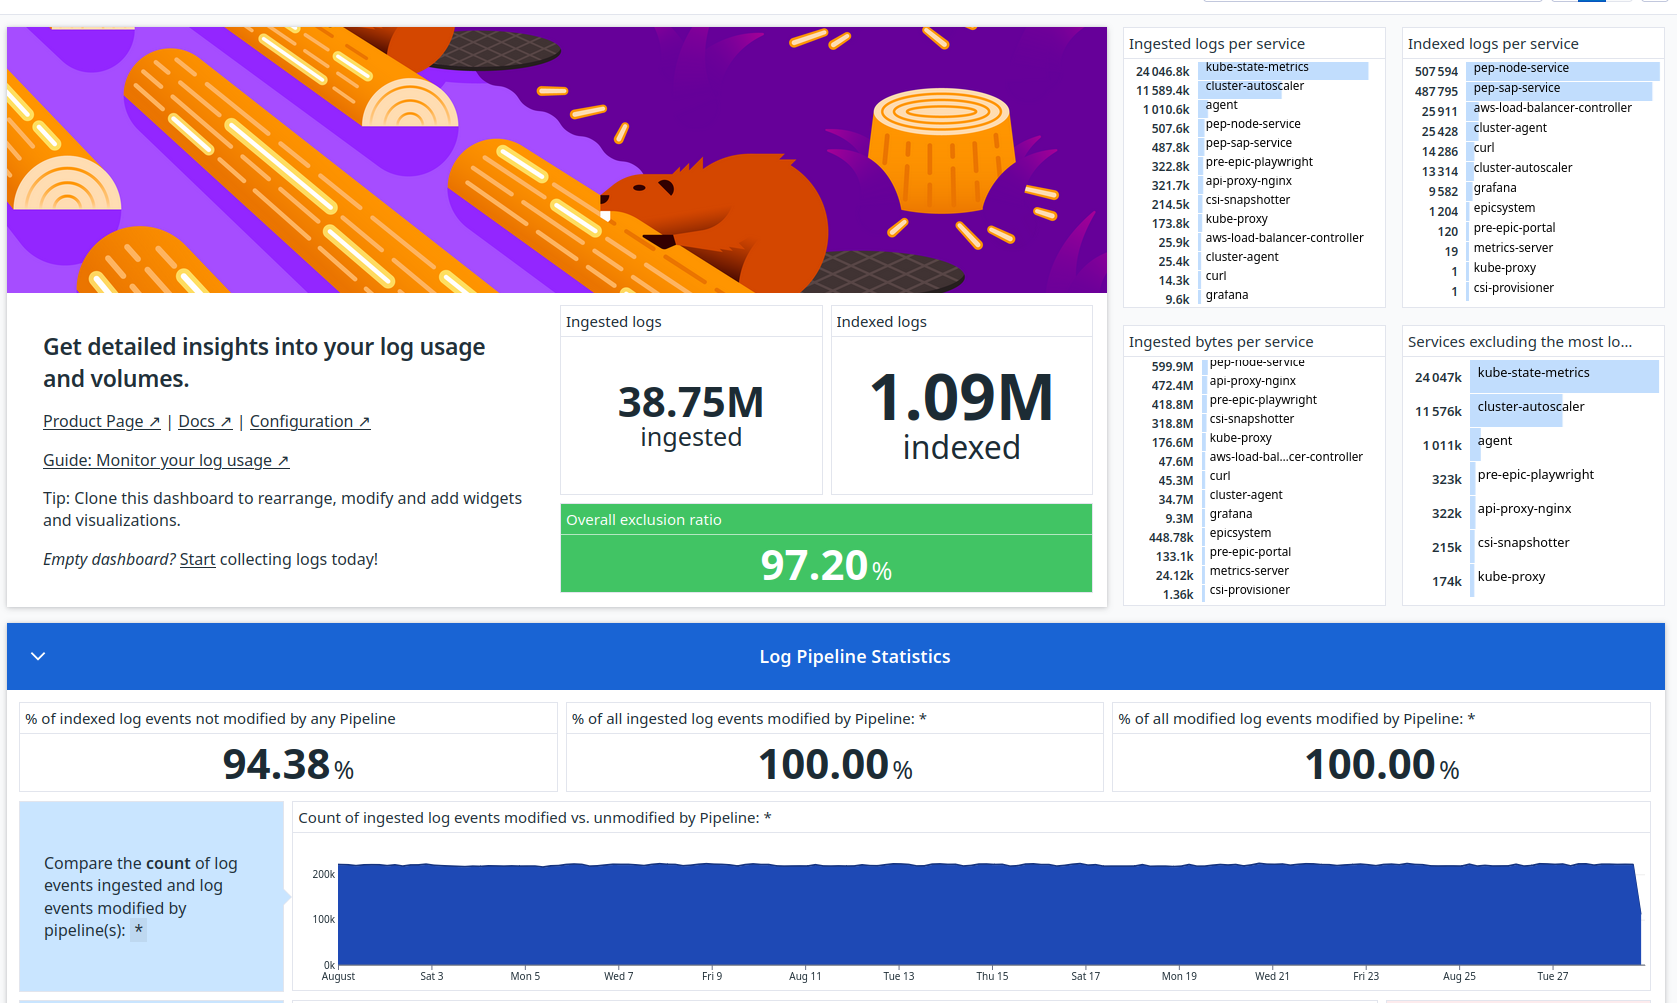
The out-of-the-box Log Management – Estimated Usage dashboard.
Creating and Managing Log Indexes for Cost Optimization and Effective Data Handling
Log Indexes offer precise control over your Log Management budget by allowing you to segment data into different value groups. This segmentation enables you to apply varying retention periods, set daily quotas, monitor usage, and manage billing effectively.
Datadog suggests using multiple indexes when you need:
- Different retention periods for various log data.
- Separate daily quotas to achieve finer budget control.
Creating indexes
- By default, each new account gets a single index (main) representing a monolithic set of all your logs. The filter in this index is *. All ingested logs are filered into the main index.
- You can create an index for any subset of ingested logs by using tags and attributes from log data to create the filter query. For each index, you can set the retention period, daily quota and reset time, and warning threshold, as shown in the image below.
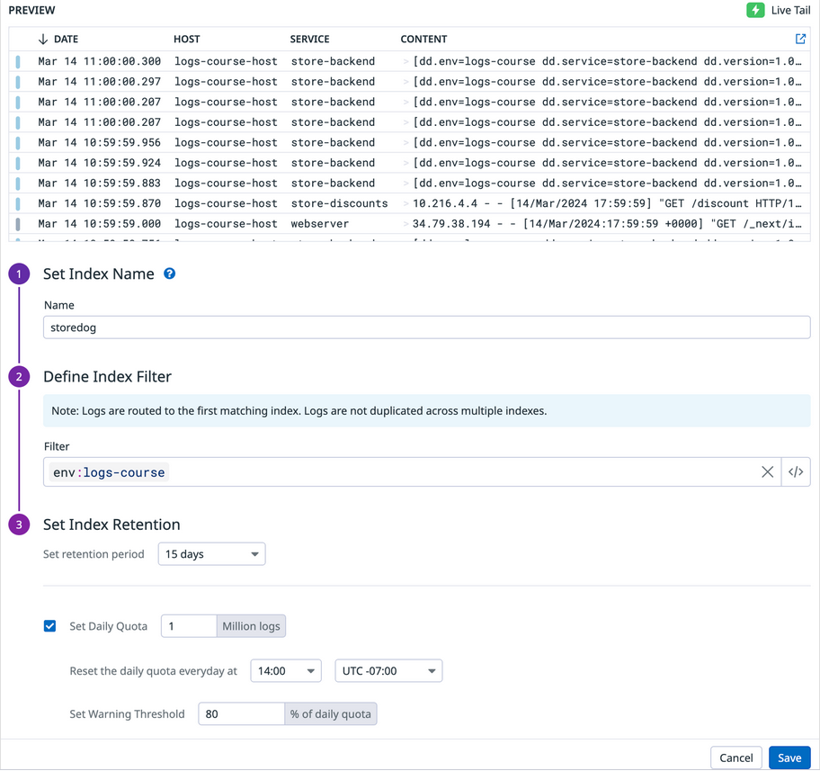
The New Index editor filled out to create an index for storedog logs.
- Index names must begin with a letter and can only include lowercase letters, numbers, or the ‘-’ character. Logs that are filtered into an index are assigned a tag based on the index name. In the example, all logs passed into this index will be assigned the tag datadog_index:storedog because the name of the index is storedog.
- Index filters provide dynamic control over which logs flow into which index. In the example, all logs with the env:logs-course tag will flow into the storedog index.
- The index retention setting determines how long logs are stored and searchable in Datadog. By default, 15 days is the only available retention period. You’ll need to contact Customer Success, success@datadoghq.com, to have other retention periods made available in your organization’s Datadog account.
- You can set a daily quota to hard-limit the number of logs that are stored within an index per day. After the daily quota is reached, logs are no longer indexed but are still available in the Live Tail, sent to your archives, and used to generate metrics from logs.
Ordering indexes
As you create indexes, be sure to move all indexes above the default main index and order the indexes as needed.The order of indexes in the Index list matters! In the example below, the storedog index was moved above the main index so that all logs that match the filter for the storedog index are filtered into this index while all other logs are filtered into the main index. If the main index was above the storedog index, all storedog logs would be filtered into the main index.
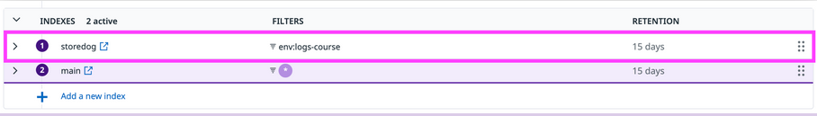
The storedog index is listed above the main index.
Querying indexes
You can query across one or multiple indexes in Log Explorer using the Index facet.
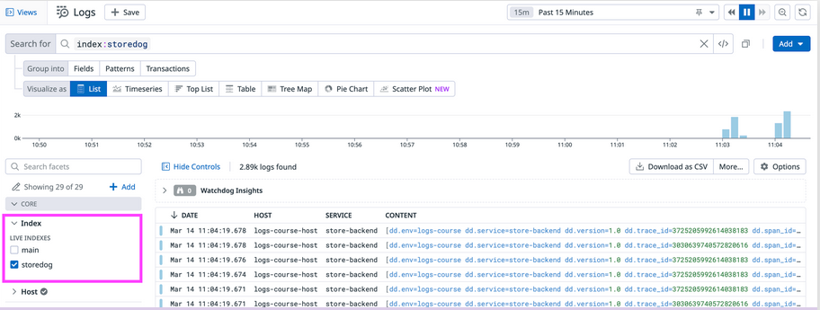
storedog is listed under the Index facet in the Log Explorer.
Configuring Log Exclusion Filters for Effective Index Management
- By default, log indexes have no exclusion filters, meaning all logs that match the index filter are indexed. However, you can add exclusion filters to indexes to control which logs should be excluded, as not all logs are equally valuable.
- Excluded logs are not indexed but still flow through Live Tail, can be used to generate metrics, and can be archived. The index quota applies only to the logs that are indexed, not to those that are excluded.
- Exclusion filters are defined by a query, a sampling rule, and an active/inactive toggle.
- The default query is *, meaning all logs flowing into the index will be excluded. To narrow down the logs that should be excluded, you’ll need to add a specific filter query.
- The default sampling rule is Exclude 100% of all logs matching the query. You can adjust the sampling rate between 0% to 100%. You can also decide if the sampling rate applies to all the filtered logs or to groupings of the logs defined by the unique values of any attribute.
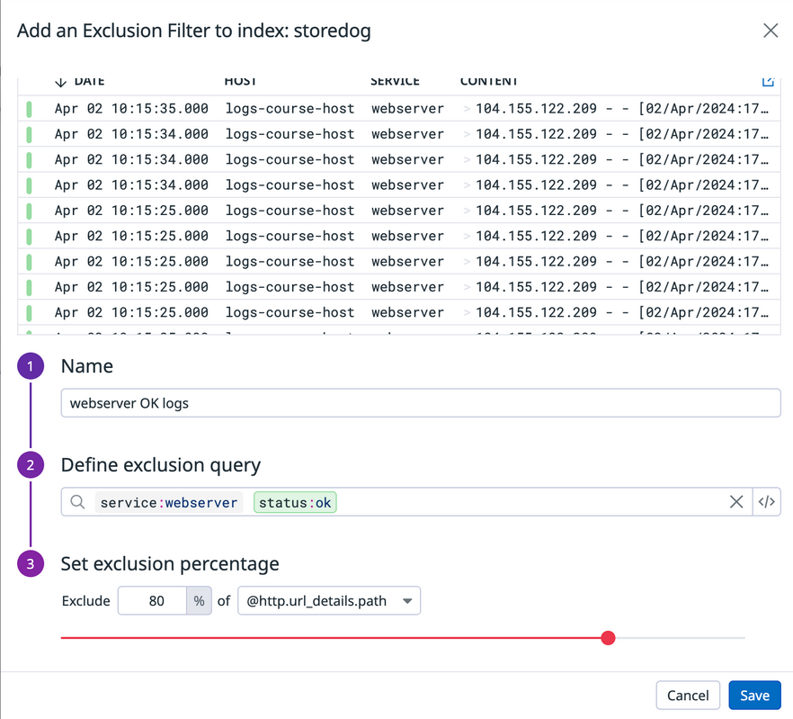
The “Add an Exclusion Filter to index: storedog” editor filled out to create the filter for webserver service logs with ok status.
- The default toggle position is active. Logs flowing into the index are discarded according to the exclusion filter configuration. When the toggle is set to inactive, the filter is ignored.
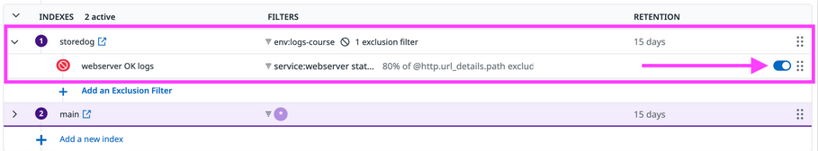
The new Exclusion Filter is listed for the storedog index.
Best Practices for Indexing and Managing Log Data to Optimize Costs and Performance
In general, consider these points while you’re determining whether you should index, flex or archive logs from different sources:
- When you have incredibly high volumes (millions to billions) of the same log, you don’t need to keep every single one.
- Apply sampling strategies that ensure that you are indexing enough logs for an accurate representation of those logs.
- Not all logs are created equal.
- For example, don’t store/index your debug logs unless you believe it’s necessary to do so.
- “Don’t chase the tail” — apply the “80/20 rule” to your index optimizations and configurations
Conclusion
Datadog Log Management decouples log ingestion and log indexing with Logging without Limits to help you manage costs. You can have Datadog ingest and process all logs from all of your log sources. You can also manage retention periods and daily quotes for indexed logs for finer-grained control over costs. Regardless of which logs you store, index, or discard, you can use Live Tail, Generate Metrics, and Cloud SIEM detection rules on all ingested logs.


