
Strategic Logging with Loki: Managing Complex Logging in Modern IT Environments
In the rapidly evolving landscape of cloud-native technologies, efficient logging is critical for maintaining business continuity and operational excellence. As organizations increasingly adopt microservices architectures on platforms like Kubernetes, the volume and complexity of logs can quickly become overwhelming. Our project faced the challenge of managing these large-scale logs while ensuring that they remained accessible, searchable, and integrated within our existing observability framework. In this blog, we’ll explore how implementing the Loki Distributed Logging System helped us overcome these obstacles, driving better decision-making and improving overall system reliability.
Problem Statement:
Our project involved a microservices-based architecture running on Kubernetes, where we needed a reliable, scalable solution for aggregating, querying, and visualizing logs from multiple sources. The challenges included handling large volumes of logs, ensuring efficient log searching and filtering, and integrating seamlessly with our existing observability stack.
What is Loki?
Loki is an open-source log aggregation system designed to efficiently store and query logs. Developed by Grafana Labs, Loki is inspired by Prometheus but for logs. Unlike other log management tools, Loki is designed to be cost-effective and simple to operate. It avoids indexing the full log content and instead indexes only metadata such as labels. This approach makes Loki highly scalable and easier to manage.
Architecture of Loki:
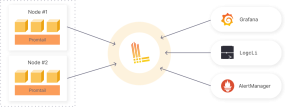
loki arch
Loki Deployment Label:
- In monolithic mode, all of Loki’s microservice components run inside a single process as a single binary.
- Simple Scalable mode, if you want to separate read and write paths.
- In microservices mode, every Loki component runs as a distinct process.
Available Solutions in the market:
Several logging solutions were considered:
- Elasticsearch, Logstash, and Kibana (ELK Stack): This well-known stack provides powerful search and visualization capabilities. However, it requires significant resources to maintain, and setting up and scaling Elasticsearch can be complex and costly.
- Splunk: Known for its robust features and scalability, Splunk offers comprehensive log management. But, its cost and licensing structure can be prohibitive, especially for smaller teams or projects.
- Fluentd with Elasticsearch: Fluentd is a versatile log collector, but combining it with Elasticsearch still inherits some of the challenges related to Elasticsearch’s resource demands and management overhead.
- Grafana Cloud Logs: This managed service integrates well with Grafana but comes with its own set of pricing and data management concerns.
Why We Chose Loki?
After evaluating these options, we decided to go with Loki. Here’s why:
- Seamless Integration with Grafana: Since we were already using Grafana for monitoring and visualization, Loki’s integration was a natural fit. This allowed us to centralize our observability stack and manage logs alongside metrics and traces without needing a new tool.
- Scalability and Efficiency: Loki’s design is optimized for efficiency and scalability. It indexes only metadata, not the full log contents, which reduces storage and query costs. This made it easier for us to handle large volumes of logs without the overhead associated with traditional log management systems.
- Simplified Deployment: Loki’s deployment was straightforward, especially with Helm charts for Kubernetes. This simplified our setup process and minimized the operational burden.
- Cost-Effective: Loki proved to be a cost-effective solution compared to other options. Its efficient indexing model means lower storage and query costs, which align with our budget constraints.
How Loki Helped Us?
Loki significantly enhanced our logging setup in several ways:
- Unified View: By integrating Loki with Grafana, we achieved a unified view of metrics and logs. This provided a holistic perspective on application performance and system health, enabling faster troubleshooting and better insights.
- Efficient Log Management: With Loki’s efficient indexing, we managed to keep our logging infrastructure lightweight. This was particularly useful as our log volume grew, ensuring that performance remained consistent.
- Enhanced Troubleshooting: The ability to easily search and filter logs in Grafana helped us quickly identify issues and correlate logs with metrics and traces. This streamlined our debugging process and improved overall productivity.
- Scalability: As our application scaled, Loki’s architecture allowed us to handle increased log volumes without significant reconfiguration. This scalability ensured that our logging solution kept pace with our growing needs.
Conclusion:
Loki is a powerful and cost-effective log aggregation system that addresses the challenges of log management in modern environments. Its integration with Grafana, scalability, and ease of use make it an excellent choice for centralized log management, especially in Kubernetes and microservices architectures. By focusing on metadata indexing, Loki offers a cost-efficient solution for storing and querying large volumes of log data, making it a valuable tool for monitoring and troubleshooting applications.
Whether you are managing a small application or a large-scale microservices deployment, Loki provides the capabilities you need to aggregate, monitor, and analyze your logs effectively. With Loki, you can gain valuable insights into your system’s performance and health, helping you to ensure the reliability and stability of your applications.
Loki doesn’t index the actual text of the logs. The log entries are grouped into streams and then indexed with labels. In that way, Loki not only reduces the overall costs but additionally reduces the time between ingestion of log entries and their availability in queries.


