
Integrating Python JSON Logger with Grafana and Loki for Enhanced Logging
Introduction
In the era of modern applications, logging plays a critical role in understanding the health and performance of systems. Traditionally, logs were written in plain text, but as systems scale, the need for structured logging becomes essential. JSON logging is a powerful solution for structured logging, allowing logs to be parsed, filtered, and analyzed easily. It has become a standard for applications where observability, debugging, and performance monitoring are key priorities. JSON logs provide a structured way to store log data, making it easier to manage large volumes of logs. Integrating JSON logging with visualization tools like Grafana provides real-time monitoring capabilities, allowing businesses to stay on top of their system’s performance and quickly respond to anomalies.
Read More: Enhancing JSON Response Dynamically in AEM with Sling Filters
Why JSON Logs?
- JSON (JavaScript Object Notation) is a lightweight, text-based format that is easily readable and writable by both humans and machines. While plain text logs serve the purpose of providing information, they often require additional parsing logic when machines need to analyze them. With JSON logs, each log entry is a structured object with key-value pairs, which enables automatic parsing by most log processing tools, monitoring systems, and alerting platforms.
- JSON is the lingua franca of modern APIs and services, making it natively supported by almost all logging platforms like AWS CloudWatch, Datadog, and Grafana. These tools can directly ingest JSON logs and allow you to visualize them using charts, graphs, and dashboards without requiring complex transformations. This helps provide real-time insights into your system’s health and performance.
- When we store logs in JSON format, you unlock the ability to perform advanced queries using tools such as LogQL (used in Grafana’s Loki) and JSMPath (a JSON query language). These tools allow for deeper insights and fine-grained filtering of log data, giving you more control over how you access and visualize your logs.
Real-World Example: Implementing JSON Logging in ReadyEducation
At ReadyEducation, we initially faced challenges due to a lack of structured logging and tools for querying or visualizing log data. This created several issues, particularly in debugging and gaining insights into the application’s performance. Critical bugs were hard to trace, and there was no clear visibility into metrics like:
- The number of requests per second the system was receiving.
- Which endpoints were consuming more time than expected.
- Identifying clients generating high traffic loads.
- Without this data, it was difficult to optimize our infrastructure or make informed decisions to improve system performance.
Transition to JSON Logging and Grafana
After implementing Python’s JSON logger, we started dumping logs in a structured JSON format. These logs were then collected by Grafana Loki and visualized through Grafana dashboards. The transformation allowed us to:
- Create multiple dashboards to monitor key metrics and application health.
- Set up alerts—for instance, triggering notifications if we received more than a certain threshold of HTTP 500 errors or monitoring unauthorized requests per minute.
- Gain insights into API performance and infrastructure management by identifying which endpoints or clients were causing issues, allowing us to optimize them.
- Debug any critical prod bug which can not be replicated in QA env, we search the logs in grafana for a given time interval and client and check the logs and find the root cause.
- This move drastically improved our ability to manage and scale our infrastructure, provided real-time insights, and enhanced our debugging capabilities
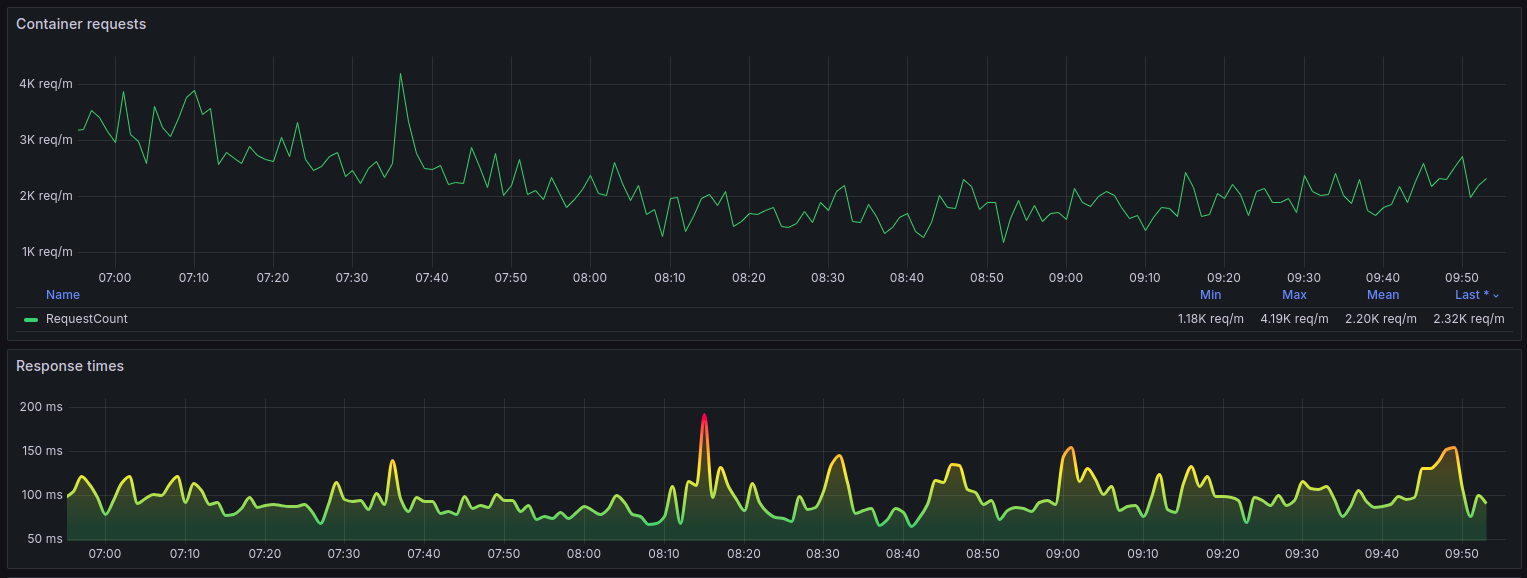
Dashboard
Application logs
Setting Up Python JSON Logger with Loki, Promtail, and Grafana
Now that we’ve seen how JSON logging improved performance at ReadyEducation, let’s walk through how to set up a Python JSON logger and integrate it with Loki, Promtail, and Grafana for querying, visualizing, and monitoring your logs.
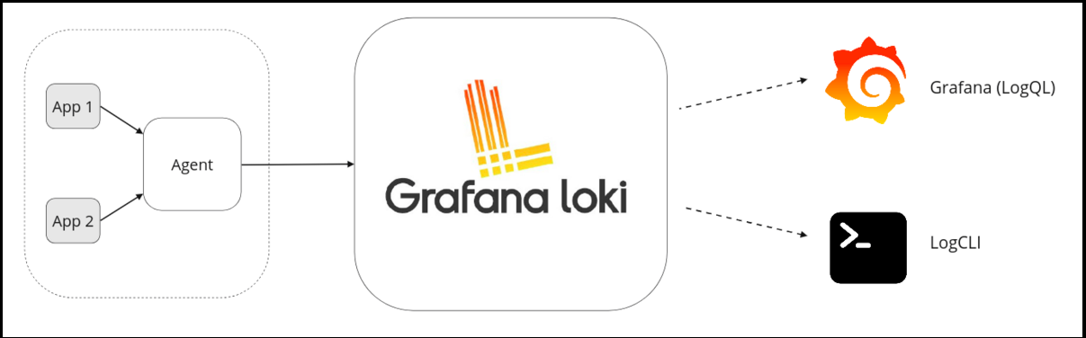
Loki integration
Read More: Introduction of Drupal JSON:API
Step 1: Setting Up Python JSON Logging
- First, you need to configure your Python application to log in JSON format. Install the python-json-logger
pip install python-json-logger
- Then, configure your logger to output logs in JSON format, this configuration ensures that logs are written in JSON format and it is dumping the logs in /var/log/ folder, which can then be easily processed by Loki and Promtail as promtail by default check the logs at path /var/log/*log if we want we can modify the default path in promtail-config.yaml file.
import logging
from pythonjsonlogger import jsonlogger
import os

# Ensure the /var/log directory exists
os.makedirs('/var/log', exist_ok=True)

# Set up logger
logger = logging.getLogger("app_logger")
logger.setLevel(logging.INFO)

# Create a file handler
logHandler = logging.FileHandler('/var/log/app_logger.log')

# Configure the JSON logger
formatter = jsonlogger.JsonFormatter()
logHandler.setFormatter(formatter)

logger.addHandler(logHandler)

# Example log message
logger.info("Application started", extra={"service": "api", "version": "1.0.0"})
Step 2: Integrating with Loki, Promtail, and Grafana
To collect, store, and visualize logs effectively, you need to set up three main components: Loki for log aggregation, Promtail as the log shipping agent, and Grafana for visualization.
- Loki is a horizontally-scalable, highly-available, multi-tenant log aggregation system inspired by Prometheus. It is designed to be very cost effective and easy to operate, as it does not index the contents of the logs, but rather a set of labels for each log stream. Grafana Loki can be used to search, analyze, and alert on logs. It can also be used in conjunction with Grafana, a popular open-source data visualization tool, to create dashboards and visualizations of log data.
- Promtail (short for “Prometheus Log Tail”) is a daemon that reads log files and sends the log data to a Loki instance. It is designed to work in conjunction with Grafana Loki to provide a log aggregation and analysis solution. Promtail runs on each node in a cluster and reads log files, extracting relevant metadata (such as labels) and sending the log data to a Loki instance. It can automatically discover new log files and can be configured to handle logs from various sources, such as Docker containers, Kubernetes pods, and system logs. This allows for a more efficient and centralized log management system.
- Grafana is the dashboarding tool used to query, visualize, and set up alerts for your logs.
For detailed installation instructions please follow their official installation guide:
- Loki and Promtail installation Guide
- Grafana Installation Guide
Once you have Loki and Promtail configured installed, you can use Grafana to visualize your logs and create alerts for critical conditions, such as high error rates or performance issue.
Setting Up Loki as data source in Grafana
- Grafana is used to visualize and monitor logs stored in Loki.
- Access the Grafana dashboard by navigating to http://localhost:3000.
- Navigate to Configuration > Data Sources > Add data source.
- Select Loki from the list of available data sources and configure the URL (e.g., http://localhost:3100).Loki as datasource
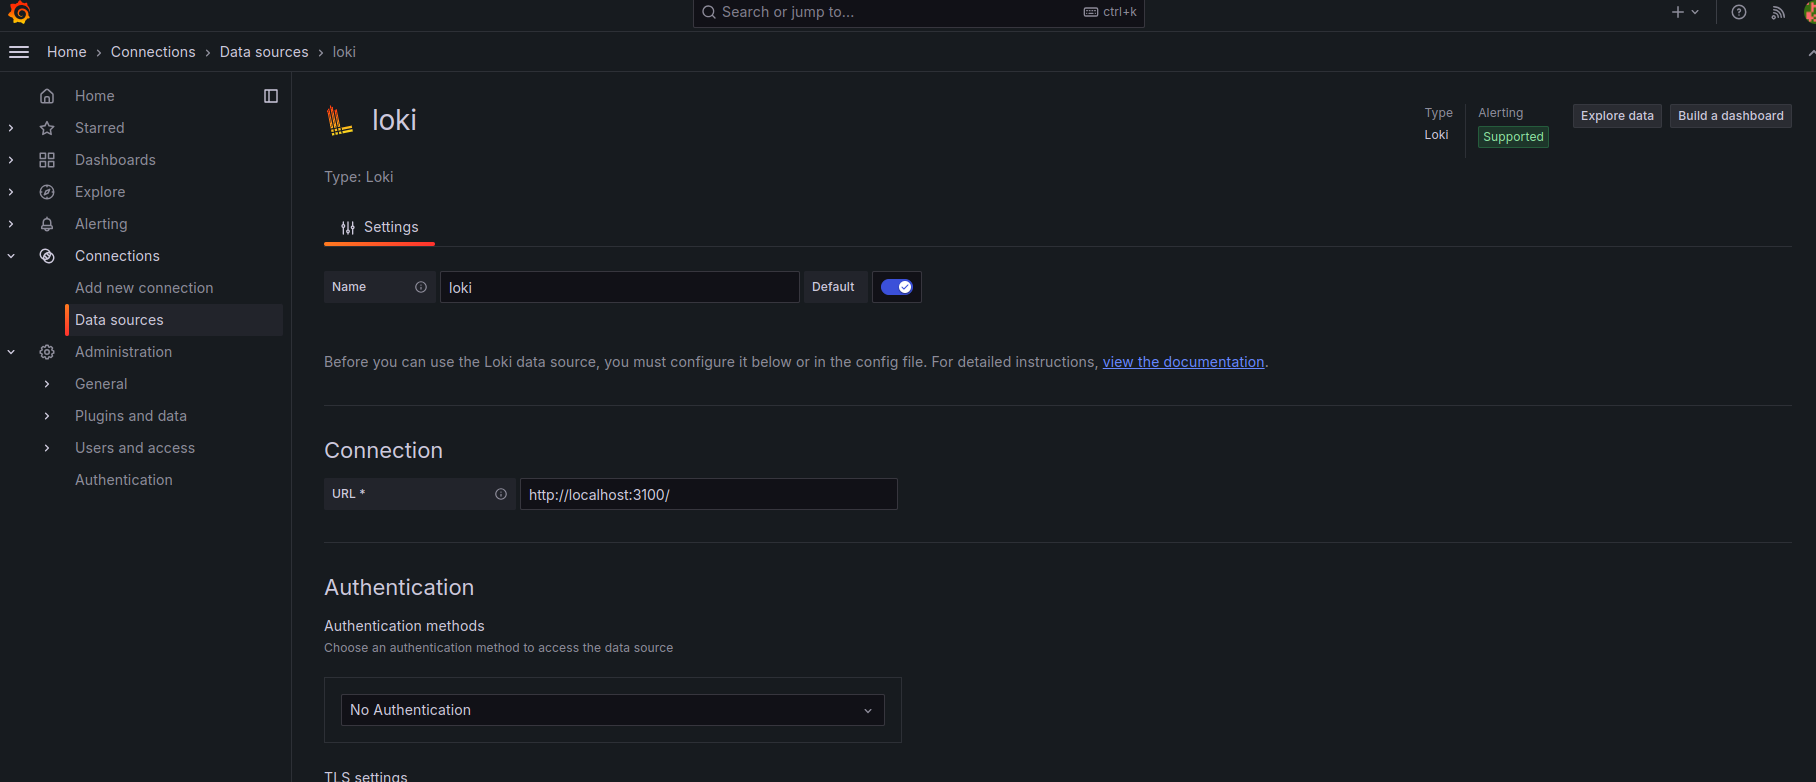
Loki as datasource
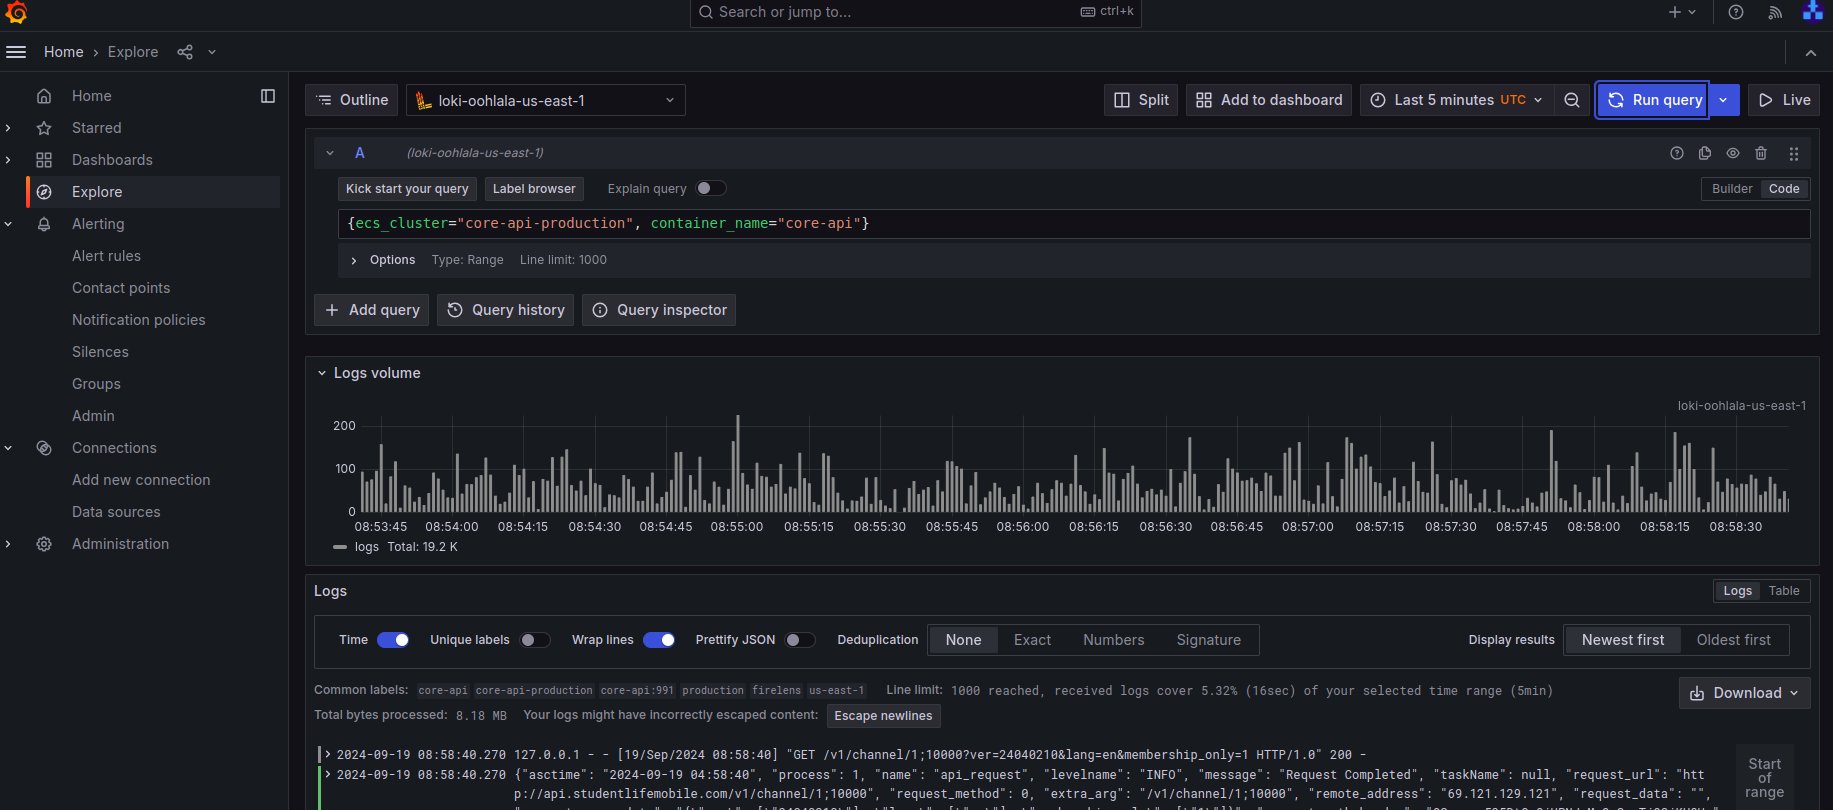
Step 3: Querying Logs with LogQL
Once Loki is integrated, you can use LogQL, a powerful query language, to search, filter, and analyze your logs from Explore section.
Conclusion
Integrating Python JSON logger, Loki, Promtail, and Grafana significantly improves logging practices, offering structured logs, real-time insights, and easy querying. This setup empowers teams with better observability, faster debugging, and enhanced infrastructure management.
At TO THE NEW, we believe that Python, as a dynamic language, holds the capability to deliver the most complex solutions in the least amount of time. We choose Python to deliver tailored business applications that require rapid development and further maintenance efforts related to scalability
