
Debug Datalayer in WebView Apps
If your client or business has both a website and a WebView app, how would you differentiate the traffic between the two? Or, how would you distinguish traffic between mobile browsers and the WebView app? We could do this using the data layer, which can be set up with the help of your development team. If you’re wondering whether the data layer concept is only applicable to websites, you might be curious about its relevance for WebView apps.
Don’t worry! In this blog, we’ll explore what a WebView app is, how to debug or validate data layer values implemented for both the web and WebView apps, and how to use Adobe Launch to capture these values and send them to Adobe Analytics.
But first, let’s understand – What is WebView? – A WebView is a component that allows developers to incorporate web content into a native application. It functions like a mini web browser within the app, displaying HTML, CSS, and JavaScript content directly within the native environment. In simple terms, a WebView app is essentially a way to display web pages within an app. This is how the data layer concept, typically used for websites, can also be leveraged in WebView apps.
Here are some Key Features of Web View:
Embedding Web Content:
-
- Load web pages, HTML content, and web applications within your native app.
- Display external web content without exiting the app.
Interaction with Web Content:
-
- Enable interaction with web content via user inputs, JavaScript, and other web technologies.
- Provide APIs to facilitate communication between web content and the native app.
Customizable:
-
- Style and configure WebViews to align with the native app’s look and feel.
- Support various settings, such as enabling JavaScript, managing cookies, and handling navigation events.
That was a brief overview of WebView apps. Now, let’s discuss how we can differentiate traffic between WebView apps and websites accessed on mobile and desktop. To achieve this, we’ll leverage the data layer with assistance from our development team. You may already have an existing data layer, or you might need to create a new one.
Read More: Extending ACS AEM Commons Reporting
The primary difference between using the data layer in a website and a WebView app lies in the method of testing it. On a website, you can simply open the console tab, type “digitalData,” and check the values. However, testing in a WebView app is slightly different, and we’ll learn how to do that.
In this example, we’ve already implemented a data layer (digitalData) that captures various pieces of information during page load. To differentiate the traffic, we’ve introduced two new parameters that pass values on every page load. This approach ensures that the entire user journey is captured with the appropriate values, making it easy to differentiate between visitors, visits, pageviews, and other actions. We will be using these two data layer variables:
-
- digitalData.page.extraInfo.visitSource: App/ Website (source of the visit will be passed(like App or website, if from webview, value will be “App”, and if from any browser it will be “Website”))
- digitalData.page.extraInfo.operatingSystem: Android / iOS (Operating system of the App, it can be iOS, Android, or any other OS on which the app is running).
Using two eVars (set to expire on visit): 1. Visit Source and 2. WebView OS, we will capture the values from the above data layer. These eVars will be mapped in a Page View rule in Adobe Launch, so that each time Adobe Analytics captures a page view, it will also capture this information.
Once this setup is complete, we need to validate the data layer. On a website, we can simply check it in the console by typing “digitalData” to view the data layer. For a WebView app, we’ll follow the same approach, but with a few extra steps since it’s within an app environment.
So let’s go that side and see how we can do that.
Before starting the debugging of your Android or iOS App, we need to ensure that Webview debugging is enabled for app which can be done with the help of Dev.
- Enable WebView Debugging in Your Android App
You need to add the following line of code in your app’s onCreate method (typically in your main Activity):
if (Build.VERSION.SDK_INT >= Build.VERSION_CODES.KITKAT) {
    WebView.setWebContentsDebuggingEnabled(true);
}
- Enable WebView Debugging in Your iOS App
On Swift side code “webview.isInspectable = true”
Prerequisites
-
- Android/iOS Device
- USB Cable to connect your Android device to your laptop.
- Google Chrome (For Android) and Safari (for iOS) installed on your laptop.
- App with Webview Debugging enabled.
Let’s start with the android app.
To remotely inspect and debug web content within a WebView on an Android device, you can use Chrome DevTools. (chrome://inspect)
Step 1: Connect Android Device to your machine
-
- Use a USB cable to connect your Android device to your laptop.
- If prompted, allow USB debugging on your Android device.
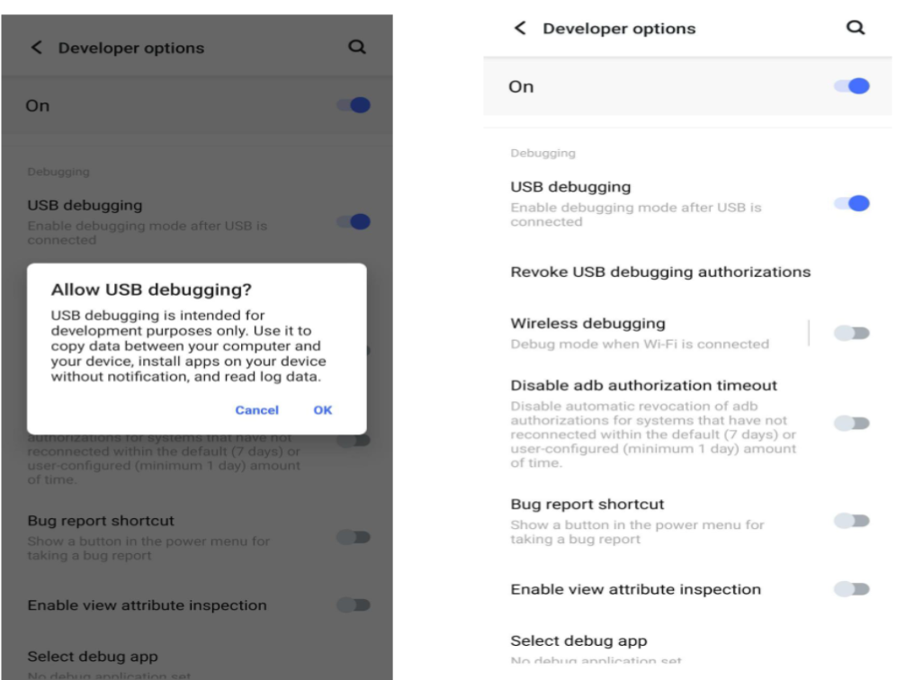
Enable USB Debugging
Step 2: Open the Chrome Developer tool in your machine
-
- Open Google Chrome.
- Navigate to chrome://inspect in the address bar.
- You should see your connected Android device listed under the “Remote Target” section.
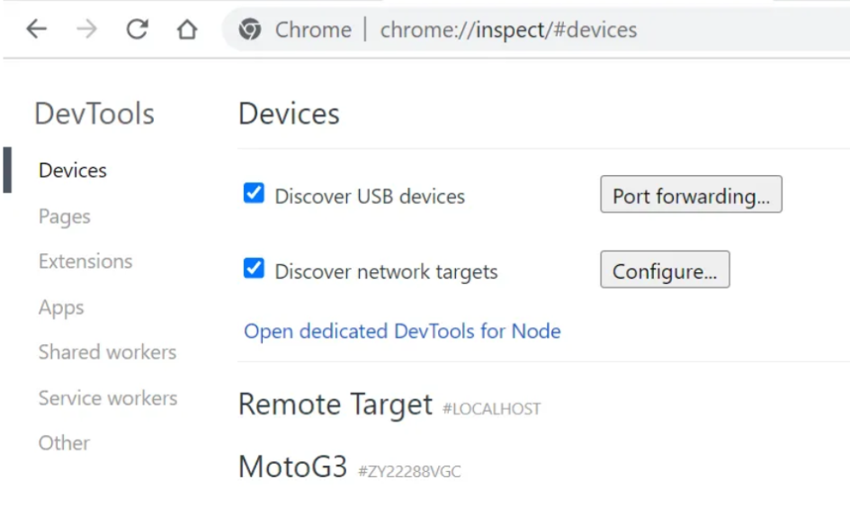
Chrome inspect
Step 3: Inspect the WebView Content
-
- In the Mobile device open the App you want to Debug, and once the app is open, Under the “Remote Target” section It should be listed with the title of the web page or the URL.
- Click the inspect link next to the WebView content you want to debug. This will open a new DevTools window, connected to the WebView on your Android device.
Step 4: Use Chrome DevTools
-
- In the DevTools window, you can use all the standard Chrome DevTools features to inspect and debug the web content within the WebView. This includes viewing the DOM, modifying HTML and CSS, setting breakpoints, and inspecting network activity.
- So we will open console tab and just like we do on web, we will write “digitalData” to check datalayer
- Troubleshooting
- Device Not Detected: If your device is not detected, make sure USB debugging is enabled and the device is properly connected. You might need to install appropriate USB drivers for your Android device on your laptop.
- WebView Content Not Listed: If the WebView content is not listed, make sure WebView debugging is enabled in your app and that your app is currently running.
Similarly we can do it for iOS but iOS is always little different so for this you can use the Web Inspector feature in Safari on macOS.
Step 1: Enable Web Inspector on iOS: Go to Settings > Safari > Advanced and turn on Web Inspector.
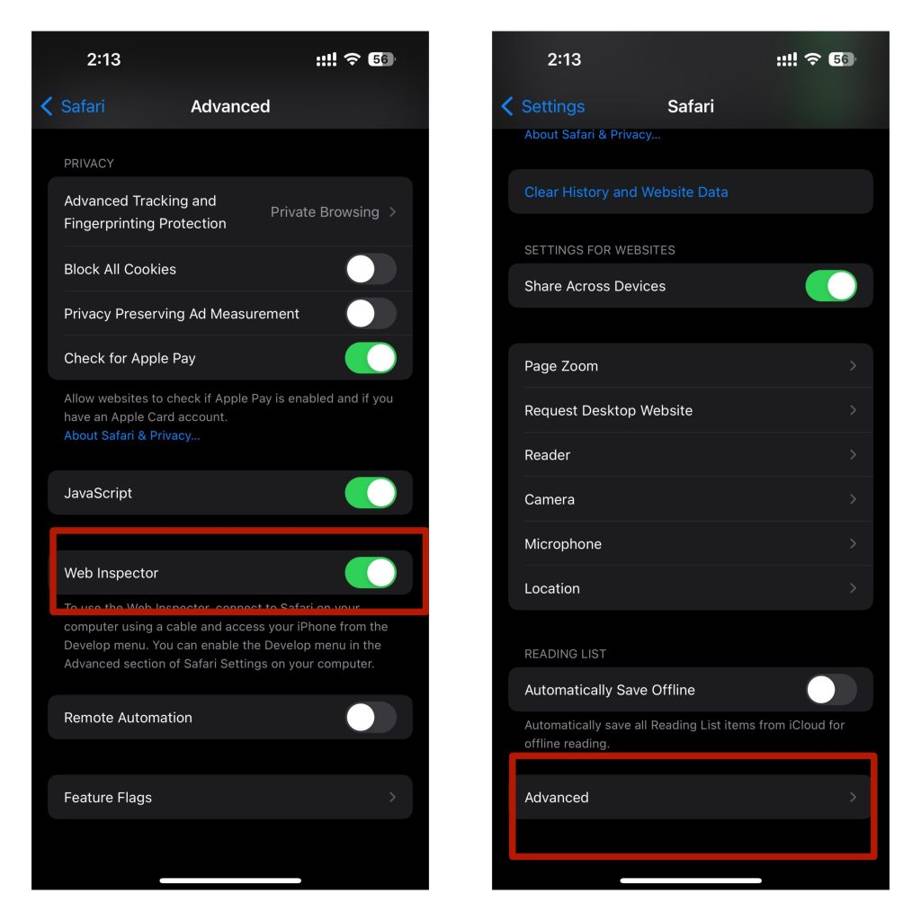
iOS Enable Web Inspector
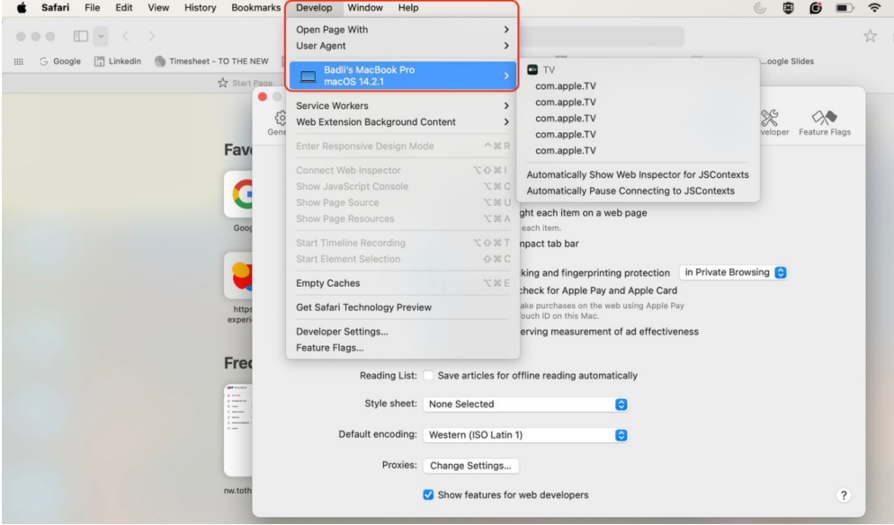
Step 2: Enable Develop Menu in Safari on macOS: In Safari, go to Settings > Advanced and enable the “Show features for Web Developers” option.
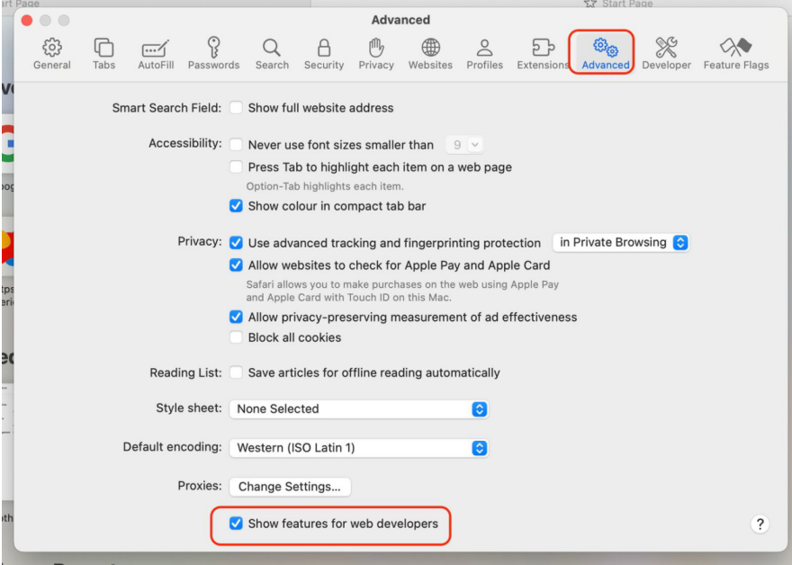
Enable Web Developer
Step 3: Connect iOS Device to Mac
Step 4: Open the WebView Content: In Safari’s Develop menu, select your iOS device and the WebView content you want to inspect.
Webview Content
Step 5: The Web Inspector window will open, allowing you to inspect and debug the web content.
Congratulations!! Hope Now you are able to validate the datalayer. Now lets talk how we can differentiate the traffic, assuming we have started capturing data in Adobe Analytics.
Using two eVars we created above 1. Visit Source 2. Webview OS
We will use them to create 3 segments:
- Traffic from Mobile Browsers only
Segment defination – Include hits,
where Visit Source = Website
AND
Mobile Device Type = Mobile Phone OR Tablet
2. Traffic from Desktop/Laptop Browsers
Segment defination – Include hits,
where Visit Source = Website
AND
Exclude hits
Mobile Device Type = Mobile Phone OR Tablet
3. Traffic from App only
Segment defination –
Include hits,
where Visit Source = App
Once its created refer a screenshot below to see how data differentiation will look like, I have used Month dimension you can use any dimension which is required.
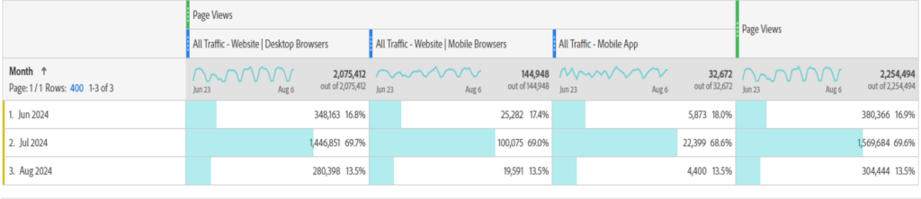
Adobe Analytics Data
Conclusion
In this blog, we’ve explored the distinctions between a website and a WebView app, emphasizing how to differentiate traffic using the data layer in conjunction with Adobe Analytics. By implementing a data layer that captures specific parameters such as Visit Source and Operating System, and mapping these values to Adobe Analytics eVars, you can effectively distinguish between traffic coming from mobile browsers, desktop browsers, and WebView apps. We’ve also covered the steps needed to debug and validate the data layer in both Android and iOS WebView apps. By creating targeted segments in Adobe Analytics, you can further refine and analyze your traffic data, ensuring that your analytics accurately reflect user behavior across all platforms.
Get real-time analytics in a unified view to devise your business strategies. Schedule a call with our Adobe Expert today!
