Advanced Debugging Techniques in Android Studio
Introduction
Debugging is an essential skill for any Android developer, but it can be a time-consuming and sometimes frustrating task. Thankfully, Android Studio offers a range of powerful debugging tools that can help streamline the process. While most developers are familiar with setting simple breakpoints, few take full advantage of the advanced features available. In this article, we’ll explore five powerful techniques—Conditional Breakpoints, Dependent Breakpoints, Breakpoint Hit Messages, Group Breakpoints, and Marking Objects to Follow Lifecycles—that can significantly enhance your debugging efficiency. By mastering these tools, you’ll be able to pinpoint issues more quickly, optimize code paths, and get a deeper understanding of your app’s behavior.

programmers every day
1. Conditional Breakpoints
Conditional breakpoints allow you to pause the execution only when a specific condition is met. Instead of manually inspecting the state each time a breakpoint is hit, you can add a Kotlin expression that evaluates to a boolean. When the condition is true, the execution halts; otherwise, it skips the breakpoint. This is particularly useful when you’re debugging a loop or an event that occurs multiple times but you’re interested in a specific scenario.
Use case: Imagine you’re iterating through a list, but you only want to pause the execution when a certain item in the list matches a condition like item.id == 5. You can set a conditional breakpoint with this statement to stop only when this condition is met.
Example: here breakpoint is enabled when the condition reselected is true
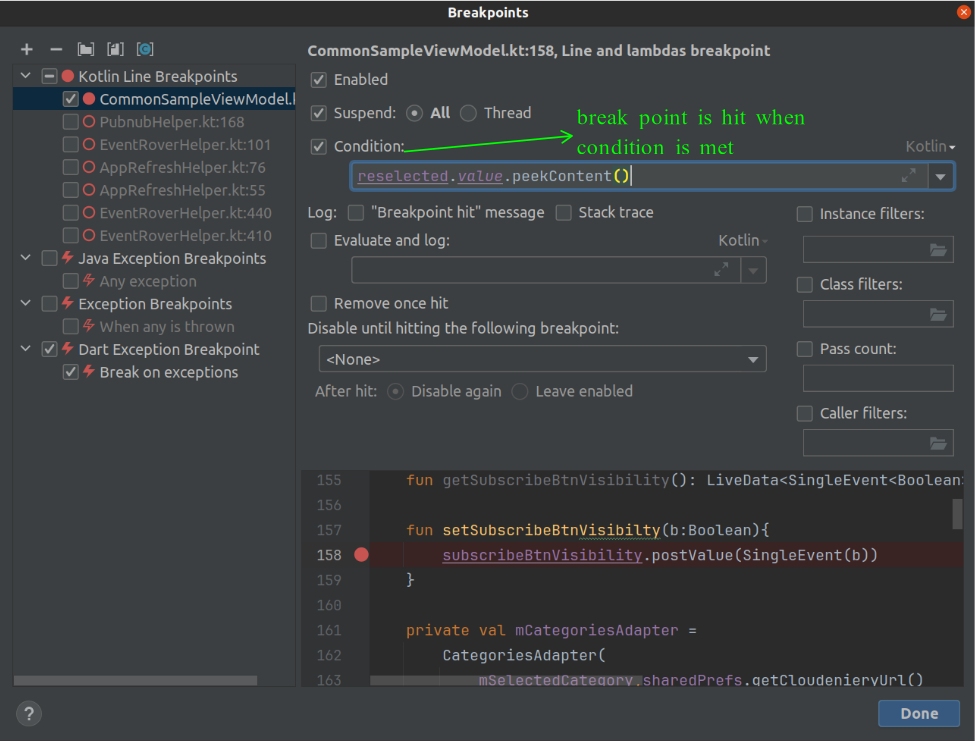
conditional breakpoint example
How to Set: Right-click on the breakpoint, select “More”, and add your Kotlin expression in the “Condition” field.
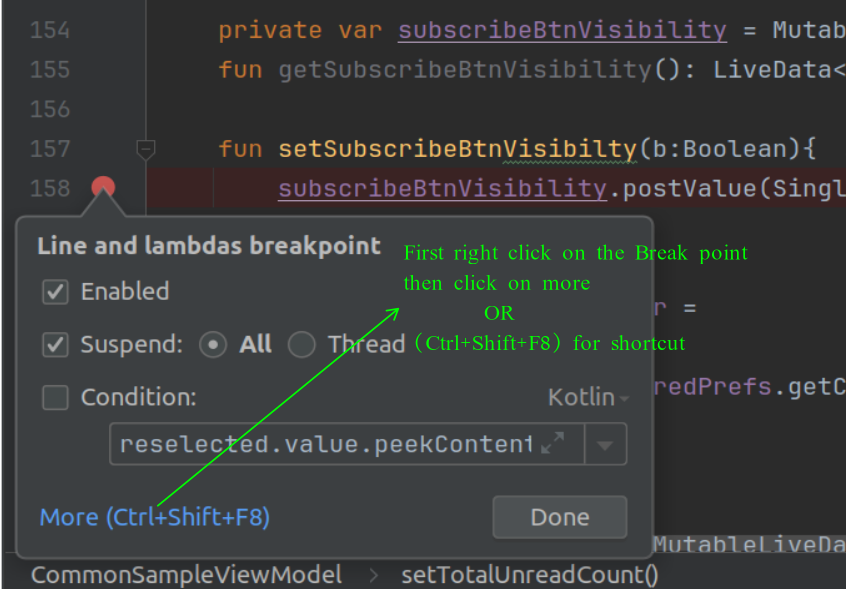
How to add Conditional Break Points
2. Dependent Breakpoints
Dependent breakpoints allow you to set a breakpoint that will only trigger if another breakpoint was hit first. This is helpful in complex debugging scenarios where you need to ensure that a certain code path is executed before another breakpoint is considered. It’s a way to ensure that the context in which the breakpoint is hit is relevant to your investigation.
Use case: For example, you have a breakpoint in a method that should only be active if a certain initialization has already taken place. You can make the second breakpoint dependent on the first, so the execution only halts after both conditions have been met.
Example: Here breakpoint isBillingFlowLaunched is disabled until layoutType == Portrait is met.
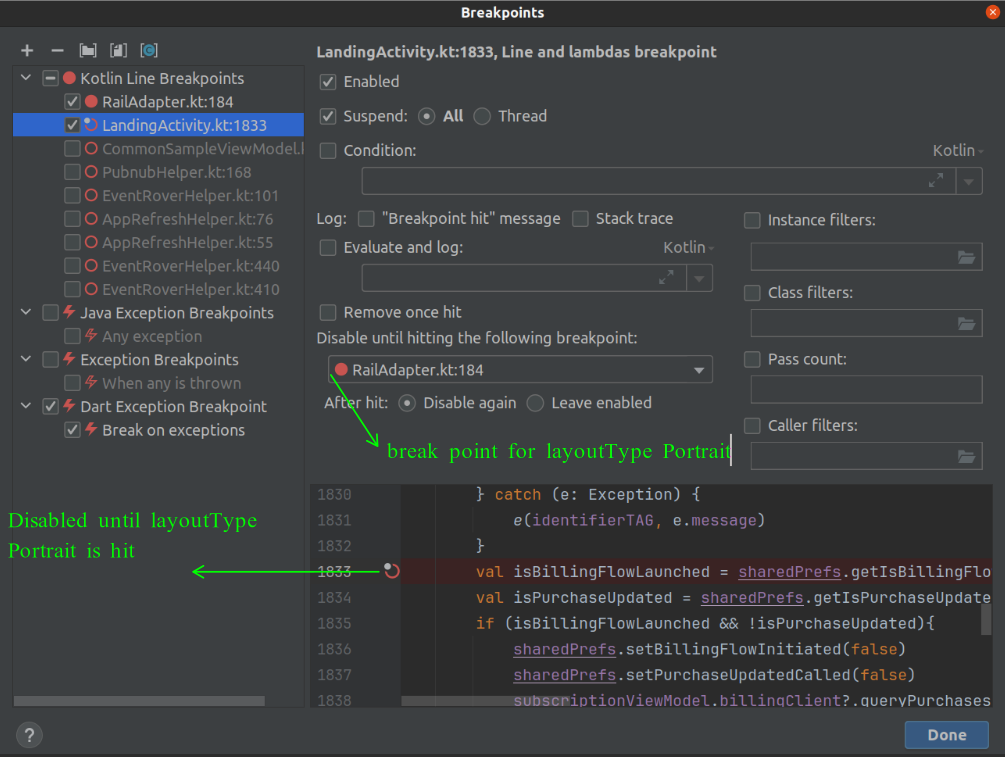
Dependent Breakpoint sample
How to Set: Right-click on the second breakpoint, choose “More” and under “Disable until hitting the following breakpoint:“, select the breakpoint from the dropdown list.
3. Breakpoint Hit Message
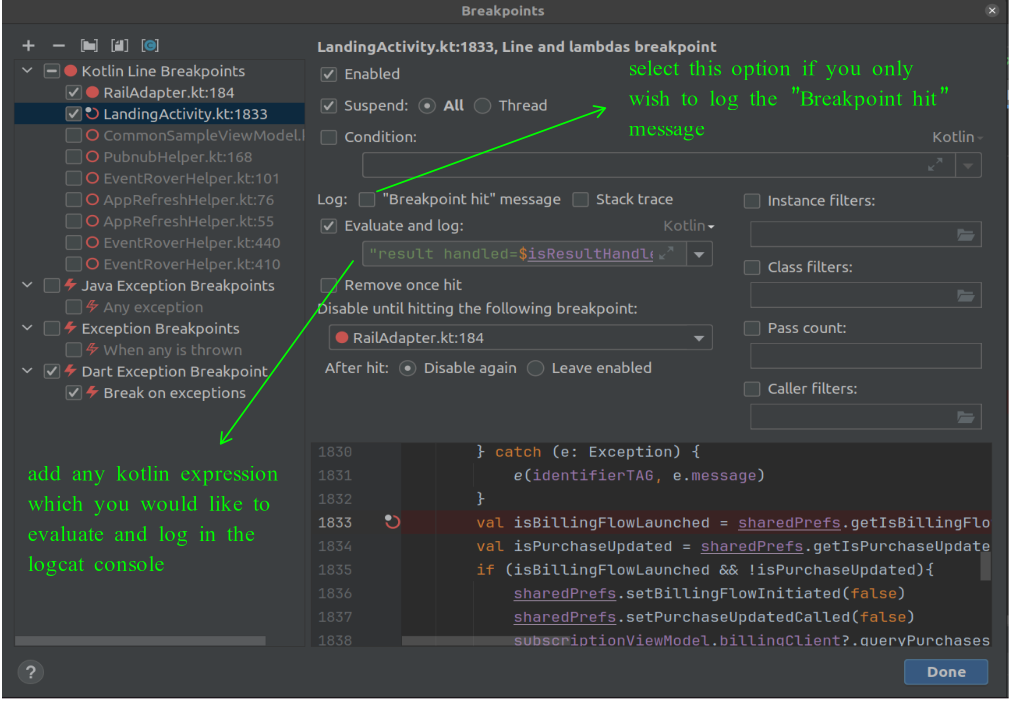
Instead of pausing the execution, you can configure a breakpoint to simply log a message to the console when it’s hit. This allows you to monitor the flow of execution without stopping the app, making it less intrusive. This technique is particularly helpful for performance-sensitive code where stopping could interfere with real-time behaviour, like in multimedia or UI rendering. You could also opt for the ‘Evaluate and Log’ option if you want to check the value of a variable.
Example: You can log variable values or execution context like Log.d(“TAG”, “Variable x value: ” + x) to see how values change during execution.
Evaluate and Log sample
How to Set: Right-click the breakpoint, go to “More”, and check “Evaluate and Log “. You can then define the message and include variables in the log.
4. Group Breakpoints
Grouping breakpoints allows you to organize multiple breakpoints under one logical unit so that you can enable or disable them all at once. This is very useful when you’re debugging different parts of your application that are independent of each other. Instead of toggling breakpoints individually, you can control entire groups based on the debugging phase or scenario you’re working on.
Example: If you’re debugging a feature with multiple methods that interact with one another, you can group all related breakpoints. When you’re done with that feature, you can disable the entire group and focus on a different feature.
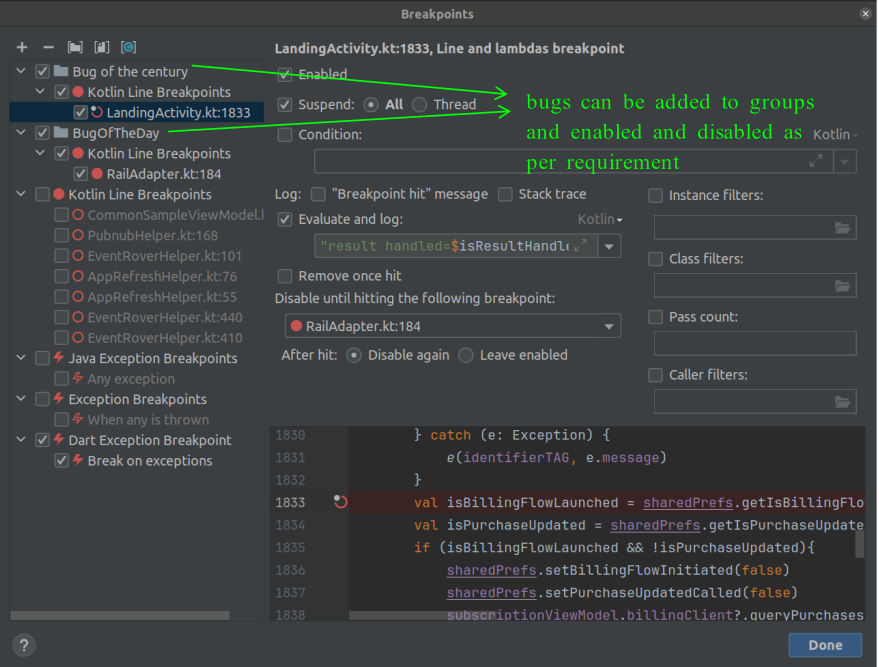
Group Breakpoints sample
How to Set: Right-click on the breakpoint and select “Move to Group”. You can create a new group or assign it to an existing one.
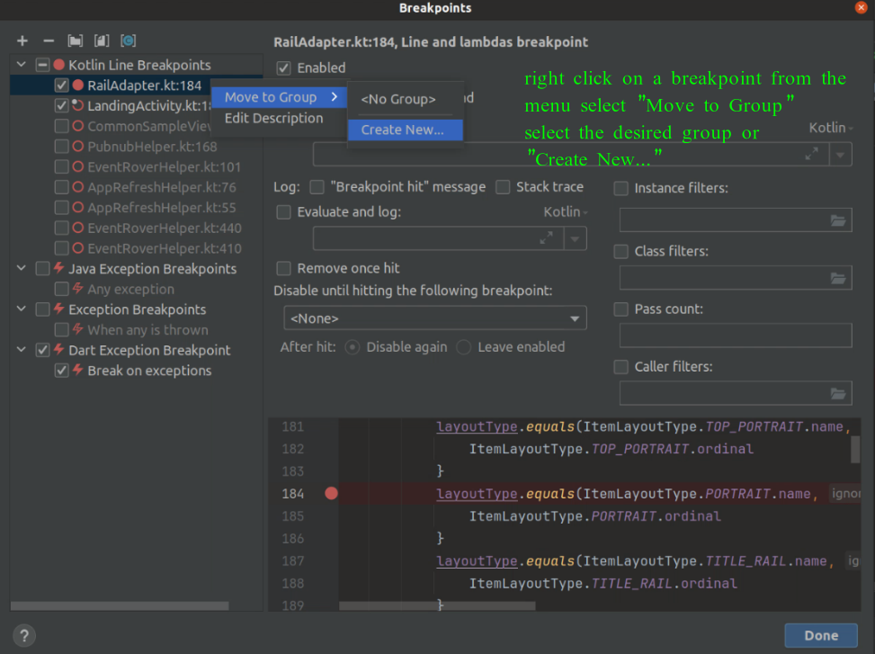
How to Group Breakpoint
5. Mark Objects to Follow Lifecycles
This technique allows you to monitor the lifecycle of a particular object, tracking when and how it’s being created, modified, and destroyed. This is particularly useful when you’re dealing with memory leaks or unwanted object retention, as you can follow an object throughout its lifecycle to ensure it’s being properly garbage collected.
Use Case: In cases of memory leaks or unexpected behaviour due to improper object handling, you can track objects to see when they are garbage collected or how often they are created or modified.
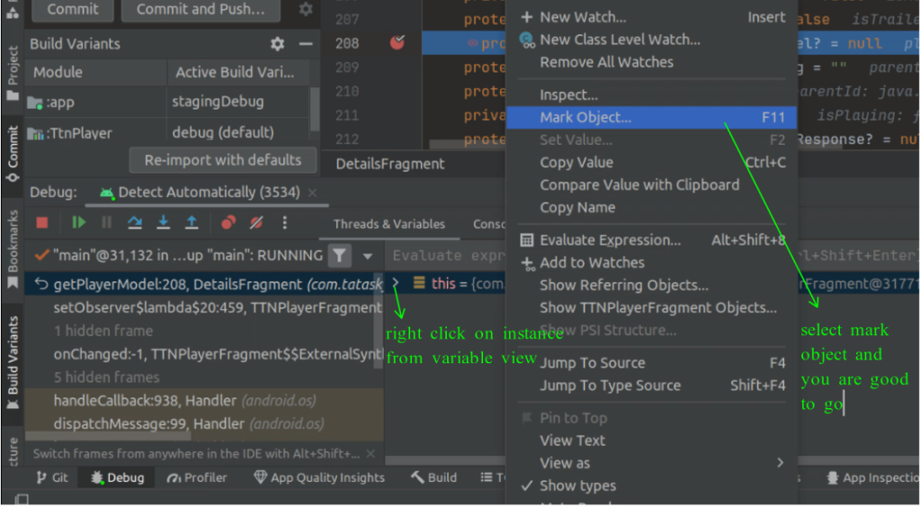
Mark Object Sample
How to Set: Right-click on an object reference in the Variables view and select “Mark Object”. This will allow you to track the specific instance across method calls and lifecycle events.
Conclusion
Advanced debugging techniques in Android Studio go beyond basic breakpoints and give developers the ability to monitor, track, and control the flow of their applications in real time. By using conditional and dependent breakpoints, you can precisely target problem areas in your code. Group breakpoints allow you to manage complex debugging sessions with ease, while hit messages and object lifecycle tracking help reduce interruptions and improve code insight. Leveraging these tools will not only help you debug faster but also improve your overall development process, ensuring a smoother path to delivering high-quality applications.