
A guide on Optimising and Improving your Flutter app performance by Using Flutter Dev Tools
Introduction of Dev tools in Flutter
Flutter Dev tool provides an in-depth analysis of App performance from UI to CPU and memory usage of the app.
Flutter provides a Profiling tool that can help in better understanding our app’s run time performance. To use profiling tools following conditions need to be taken into consideration –
- Debugging should be conducted on physical devices(iOS/Android)
- Debugging device should be the device with the lowest hardware support that most of the users might reasonably use.
- The app should run in Profile mode rather than debug
- Once the app is running in the designated mode use dev tools to launch our needed tools.
Terms Used
Unit time per frame (UTF): The device supports various amounts of frames per second i.e. it can be 60/120 frames per seconds depending on the device type. So for 60fps, frames need to render approximately every 16ms. So UTF is 16ms.
How to use Dev tools
- Once the app is launched use the ‘Open Flutter Dev Tools’ button in the debugger.
- On the tool window, the currently running app can be seen as the connected app, if not the process can be linked with the tool here.
- We can see multiple tabs that can be used to analyze our app when it’s running.
- Flutter Inspector – This tool is used to provide an in-depth analysis of the UI components that are in use on the screen. It shows us a Widget tree from the app root to the relevant widget that the developer might want to identify. Here one can select ‘Select Widget Mode’ to identify any particular Widget on the UI. By default, this tree will show the whole UI tree of the page.

Select Widget mode – UI View
- Select Widget Mode – Select Widget mode provides an In-Depth into the Widgets used on the current View that the user is viewing, this can also be used to identify any UI component and hence identify the class used to configure it.
- Performance – Devices are designed to provide rendering to a limited frame each second, when this rendering limit is exceeded the UI rendering starts to become laggy and the app experience may stop being smooth, this can be observed as jerks or UI lags.
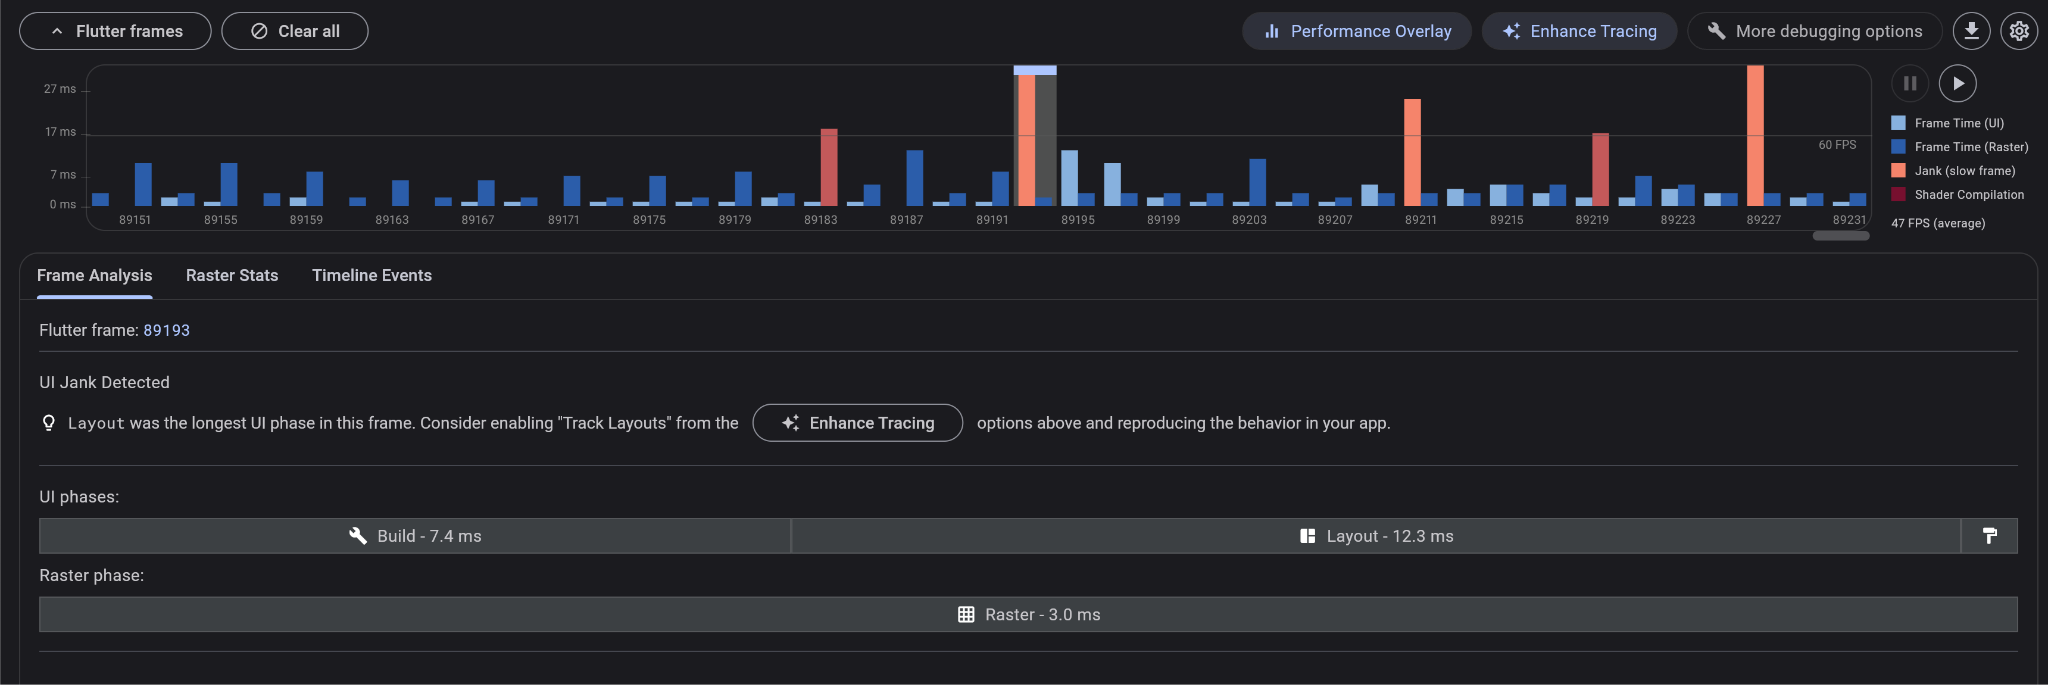
Performance View – Frame Analysis
- This tab helps in understanding the UI rendering Performance when any UI component or any page is loading in the app. The tool shows a bar graph where each bar represents a frame.
- We can get this view as an overlay on the app by using the ‘Performance Overlay’ button.
- In the overlay graph we have two graphs – the top graph (marked “GPU”) shows the time spent by the raster thread, and the bottom graph shows the time spent by the UI thread.
- A red line in the graph indicates a Jank i.e. the frame is taking more than UTF to display the content and the Dart code associated with that frame is too expensive.
- On the Performance tab, we can click on any frame that is red(hence taking over UTF to render). This will help us to identify the issue by opening the sub tabs i.e. the Raster Stats and Timeline event.
- We can use the Enhance testing option to help identify the issue for the lag. Under Timeline events we can track the events and the time taken by each event to load that frame, hence from here we can identify the most expensive event and try to reduce the time required to load it. A few ways to identify issues with the UI are mentioned in this flutter doc.
- CPU Profiler – This helps a developer record and profile the CPU performance. Record and Stop can be used to record CPU performance during a period of time. Once done the Profiling data will be fetched and then be visible across the multiple views i.e. Bottom Up, Call tree, and Method table.
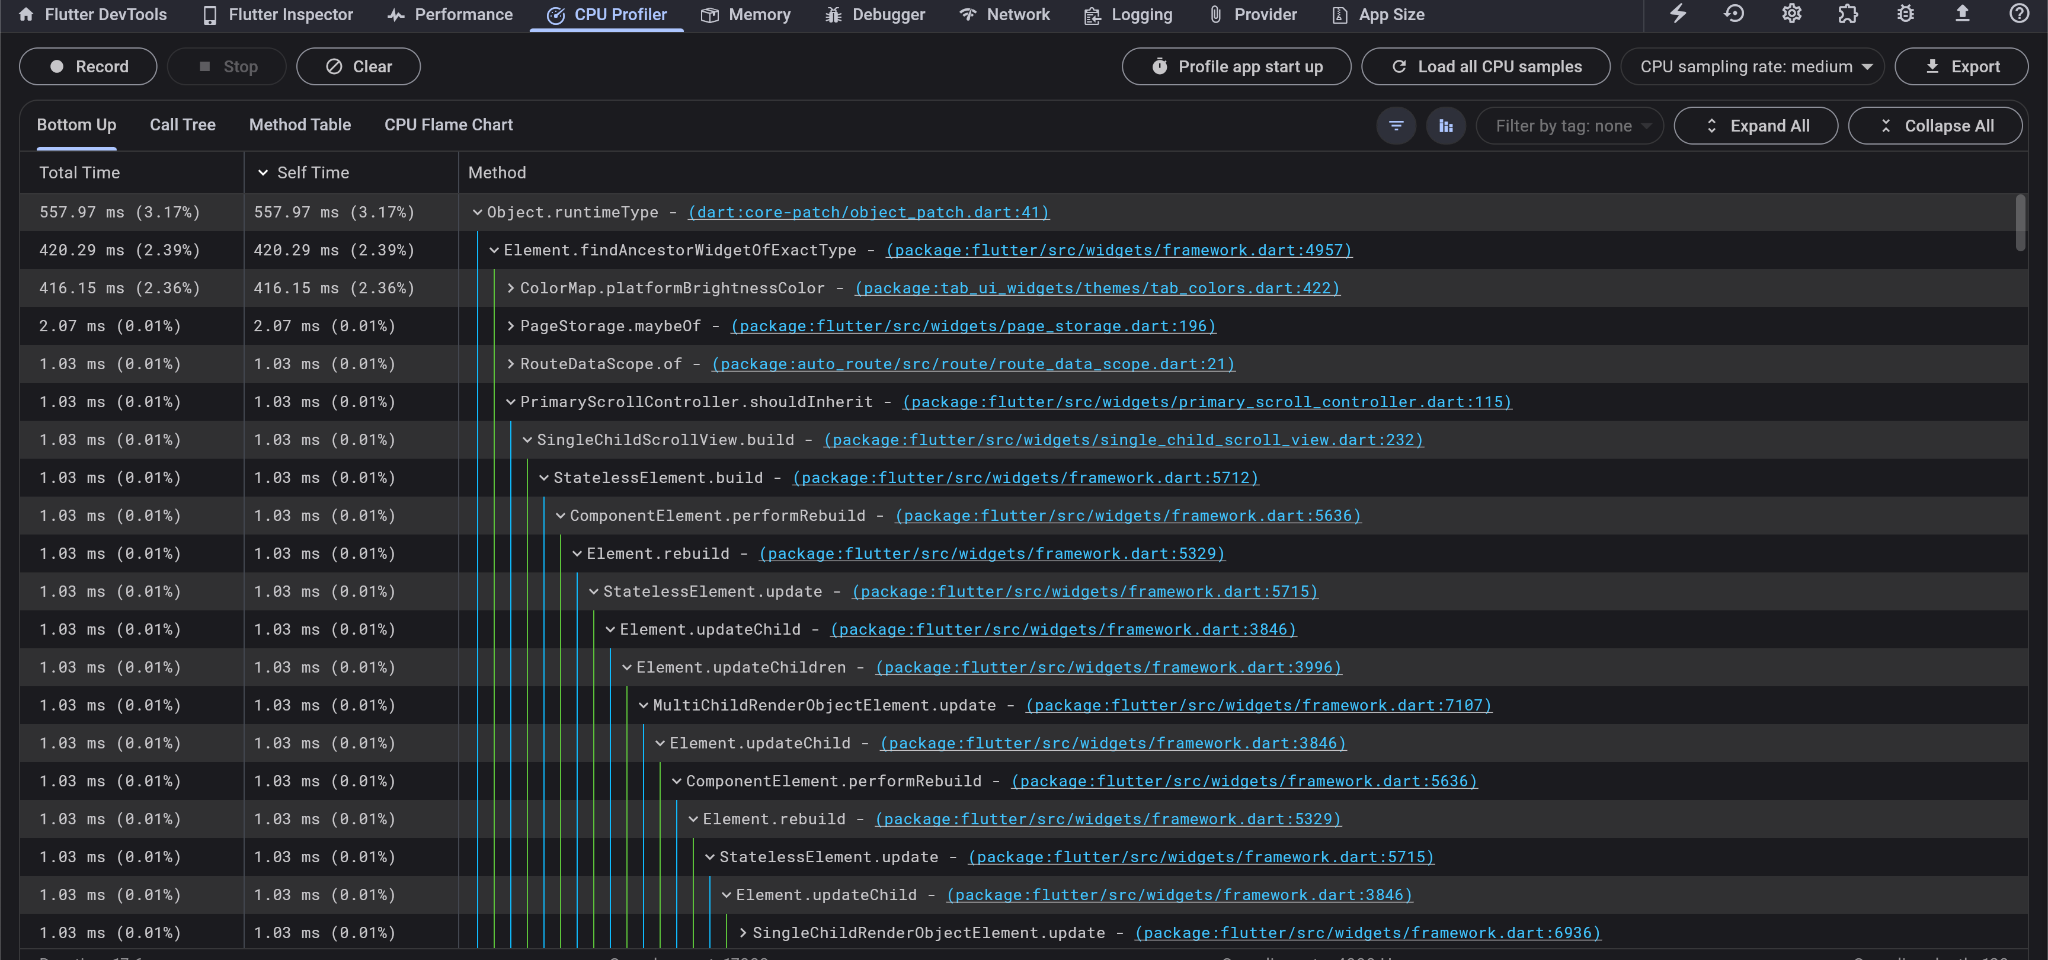
CPU Profiler Tree
- Bottom Up – In this view, the root/bottom of any call stack signifies that it was the latest call done, the leaves represent the callers. So when a method is expanded in the table it will show all the callers for that method. The total time indicated will include the time spent in total by any method to complete its task. For the root method it’s the time taken to execute itself, for children it’s the self-time of the callee when called through the child. This helps in identifying expensive methods in the CPU.
- Call Tree – This shows the top-down demonstration of the methods, each method when expanded will show its callees. Total Time indicates time spent by a method in executing itself and the code of the methods it calls. Self-time is the method used to execute only its code. This helps in identifying expensive paths in the CPU.
- Method Table – This table shows all the methods that were in the CPU during the recorded duration. Each method is individually listed on the table, we can select them and have a call graph for that method. The call graph shows a method’s callers and callees and their respective caller/callee percentages. Total time here indicates any time that method spends in the call stack, Self time is the time used by that method to execute its code.
- Flame Graph – This is the Graphical representation of the Call tree and like the call tree helps in identifying the most expensive graph. The help option here will provide the legend to help and understand how to read the graph better.
To learn more about the remaining Flutter Tools, please refer to – A Guide on Optimising and Improving your Flutter app Memory performance by Using Flutter Dev Tools


