
From Data to Design: An Introduction to Paginated Reports in Power BI
Why Do You Need Paginated Reports?
In data-driven organizations, not all reports are meant for interactive analysis or dashboards. Sometimes, precise, print-ready, large-scale reports are essential, especially for formal documentation. Have you ever tried exporting data from Power BI and noticed it gets truncated or the layout becomes inconsistent across pages? If so, you know how challenging it can be to maintain data integrity in such exports. This is where paginated reports come into play.
What Are Power BI Paginated Reports?
Power BI paginated reports are designed for structured, print-ready documentation. Unlike the dynamic, interactive reports in Power BI Desktop, paginated reports excel in presenting data across multiple pages in a consistent format. These reports are formatted to fit perfectly on a page, ensuring organized and easy-to-read content, making them perfect for traditional reporting needs such as invoices,
financial statements, inventory reports, and detailed sales reports.
Created using Power BI Report Builder and saved in the .rdl format (Report Definition Language), paginated reports ensure that no data is lost when exporting or printing.
Also Read: Data fetching in ReactJS/NextJS with useSWR
Benefits of Paginated Reports
- Print Optimization: Designed for printing, these reports ensure consistent formatting across all pages. Whether you’re printing financial reports or archiving regulatory documents, paginated reports offer precise control over layout, margins, and page orientation.
- Precise Formatting Control: Users can manage every aspect of the report’s design, including page size, item positioning, and repeating headers or footers. This makes them ideal for reports that require strict formatting standards, such as financial or regulatory documents.
- Dynamic Parameters: Paginated reports support dynamic parameters, allowing users to filter data (e.g., by date, region) without modifying the report design. This makes them versatile for different users or business needs.
- Advanced-Data Handling: They can pull data from various sources and process complex queries during report generation, supporting detailed and extensive data presentation.
- Multiple Export Formats: These reports can be exported to formats like PDF, Excel, Word, and PowerPoint, with formatting preserved across platforms, making it easy to share with stakeholders.
How to Create a Paginated Report with Power BI Report Builder
Microsoft offers Power BI Report Builder to design paginated reports within the Power BI ecosystem. This tool supports a variety of data sources, allowing users to connect and generate paginated reports from a wide range of data types. Commonly used data sources include:
- Microsoft SQL Server
- Analysis Services
- Power BI Datasets
- Azure SQL Database
- Oracle
- Excel
- XML
- CSV/Text Files
Let’s create a paginated report based on a Power BI shared dataset. You can use a dataset created in Power BI Desktop as a data source for Power BI Report Builder paginated reports.
Imagine this scenario: you’ve invested significant time designing a data model and creating a visually compelling Power BI report in Power BI Desktop. Your report includes a table with many rows, requiring users to scroll through to see all the data. However, your report readers want a print-ready version that shows all the matrix rows without scrolling.
This is where Power BI paginated reports come in. A paginated report can display your matrix across multiple pages, complete with page headers, footers, and a customized layout. It ensures that all data is visible and printable. The best part? You can base the paginated report on the same dataset used in Power BI Desktop, ensuring consistency and eliminating discrepancies between the two reports.
Below are the steps
Step 1 – Open Power BI Report Builder and select Sign In in the upper-right corner of Report Builder to sign in to your Power BI account.
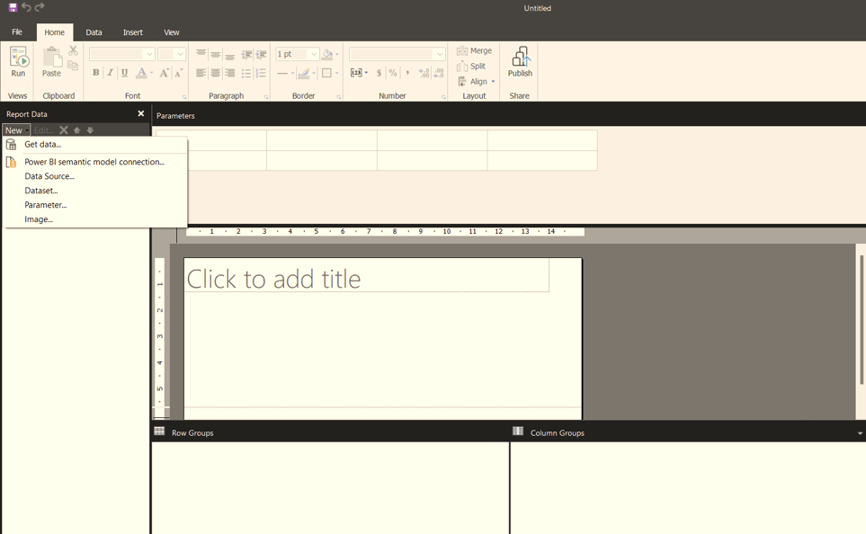
Step 2 – In the Report Data pane, select New > Power BI Semantic Model Connection.
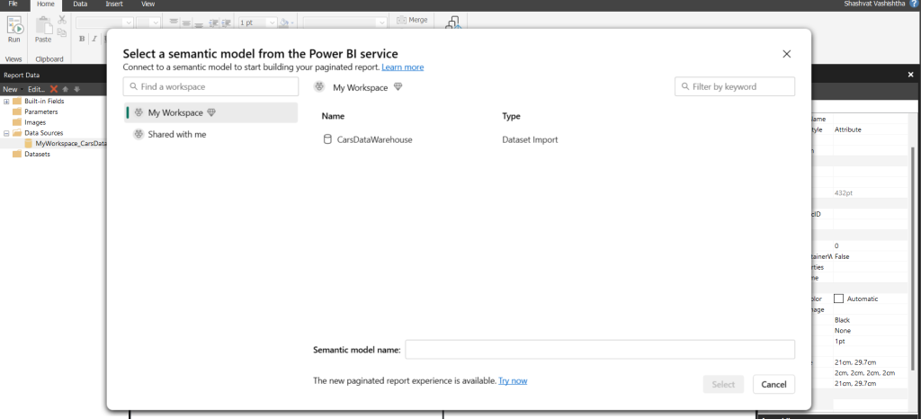
Step 3 – Search for or browse the workspace where the dataset resides. Once you locate the correct dataset, select it. Power BI Report Builder will automatically populate the dataset name, allowing you to use the same dataset as in your Power BI Desktop report.
Step 4- Once you’ve selected the dataset, it will appear under Data Sources in the Report Data pane in Power BI Report Builder.
Note: Keep in mind, that you can connect to multiple Power BI datasets (semantic models) and other data sources in the same paginated report. This allows you to combine data from various sources into a single, cohesive report while maintaining precise control over the layout and formatting.
Step 5 – Get the DAX Query for Your Power BI Dataset
To ensure the data in your Power BI Desktop report and Power BI Report Builder paginated report are the same, you’ll need to retrieve the DAX query built on the dataset. Here’s how to do it:
- Open your .pbix file in Power BI Desktop.
- Prepare a Flat Table – Ensure you have a table visual with the data you want in the paginated report.
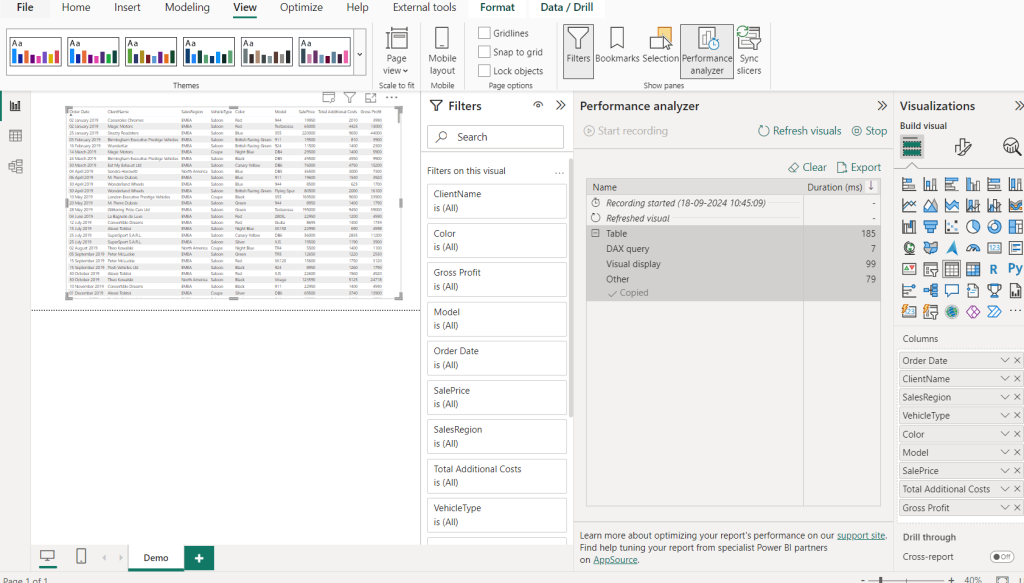
- Capture the DAX Query Using Performance Analyzer – Go to the View tab in Power BI Desktop and select Performance Analyzer. Click Start Recording and refresh the table visual to load the data. Once the table loads, click Copy Query for the corresponding entry in the Performance Analyzer pane.
- Now, you can use the copied DAX query in Power BI Report Builder to ensure your paginated report pulls the same data as your Power BI Desktop report.
Step 6 – Create the Dataset with the Query. Below are the steps to be followed:
- Open Power BI Report Builder
- Right-click on Datasets under Data Sources and select Add Dataset.
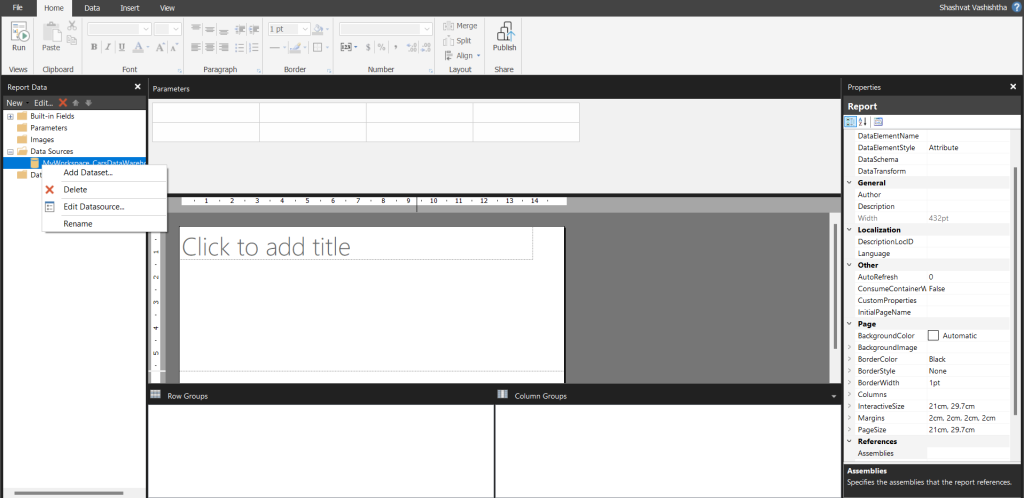
- In the Report Data pane, right-click on Datasets and select Add Dataset. In the Dataset Properties window, give the dataset a meaningful name.
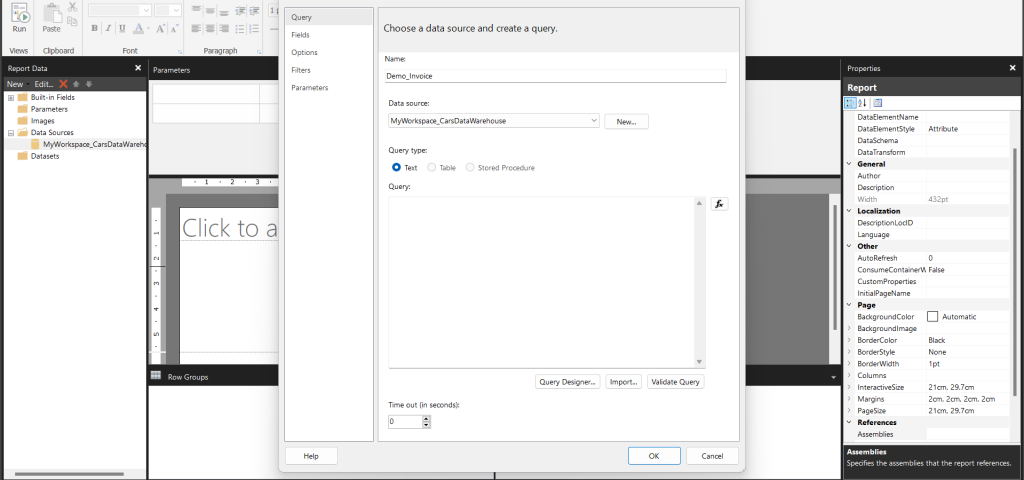
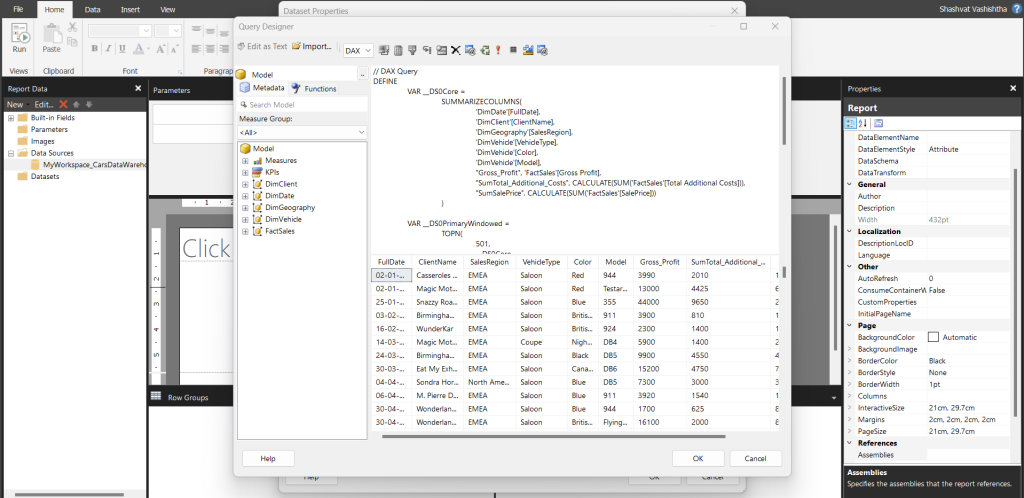
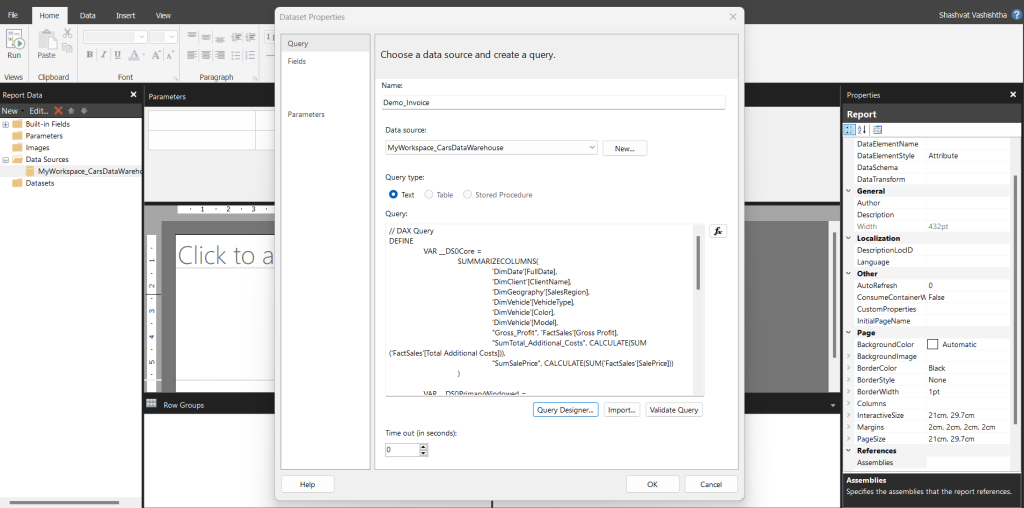
- Under the Query section, click Query Designer to open the editor. Ensure DAX is selected as the query language, and deselect the Design Mode icon to switch to Text Mode. Paste the DAX query from Power BI Desktop into the upper box, then click Execute Query (red exclamation mark) to verify that the query works.
- Select OK. You will see your query in the Query window of the Dataset Properties dialog box.
- Select OK. You will now see your new dataset along with its fields listed in the Report Data pane.
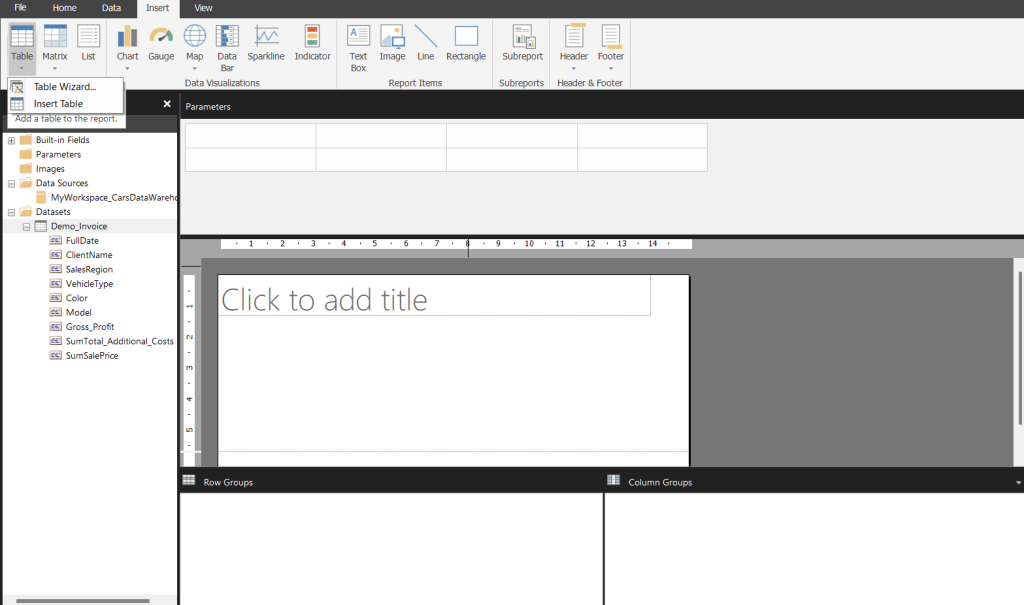
Step 7 – Create a table in the report builder by using Table Wizard. Below are the steps to do it
- On the Insert ribbon, select Table > Table Wizard.
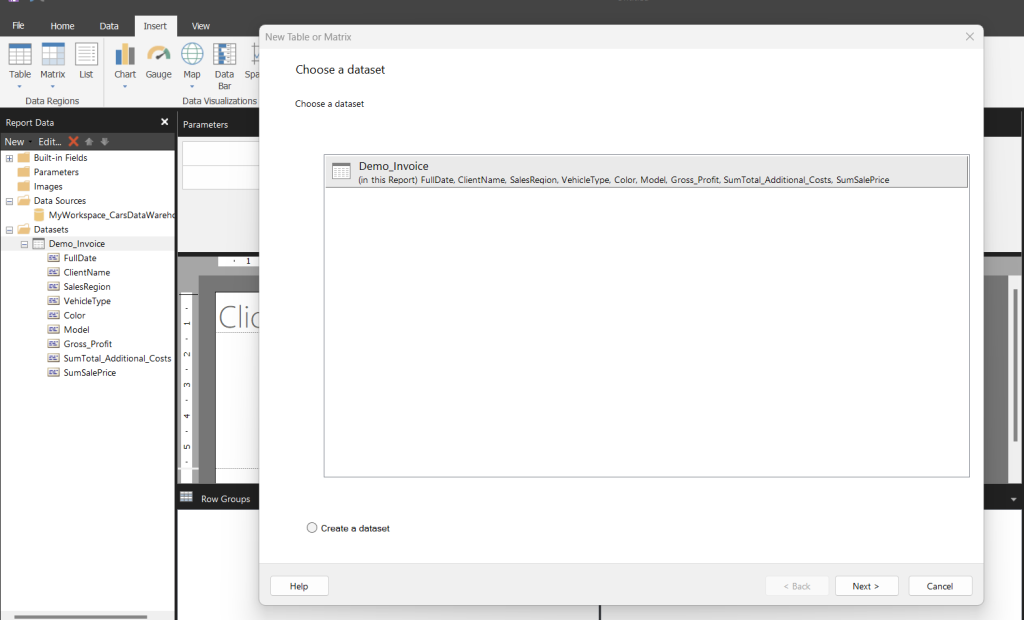
- Choose the dataset you created with the DAX query > Next.
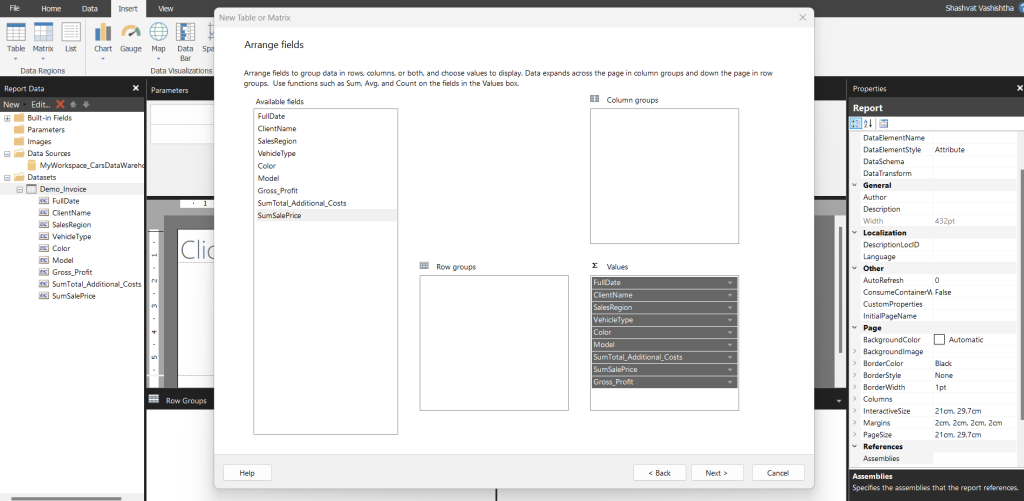
- To create a flat table, select the desired fields from the Available Fields list. You can select multiple fields by clicking the first one, holding the Shift key, and then clicking the last field. After selecting the fields, click Next.
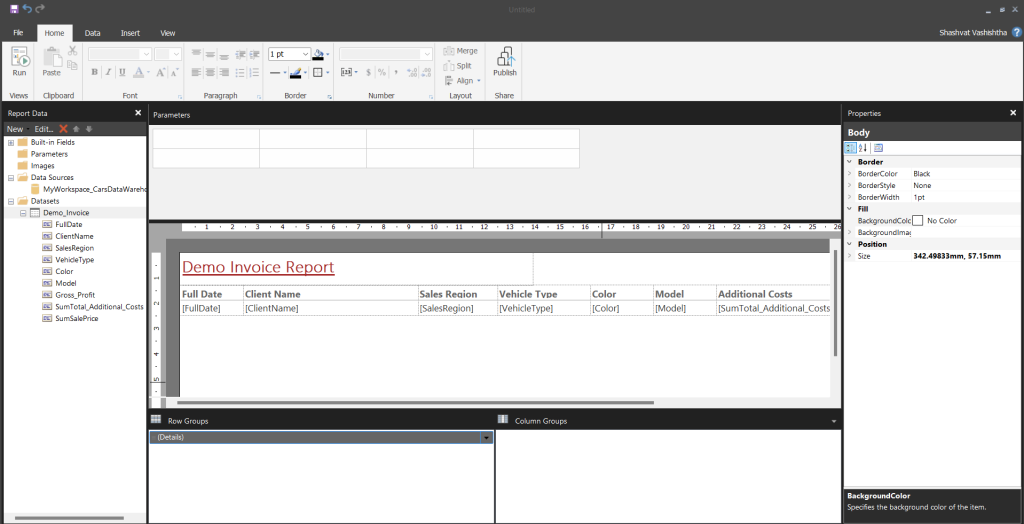
- Choose your preferred layout options and click Next, then select Finish. Your table will now appear in Design View.
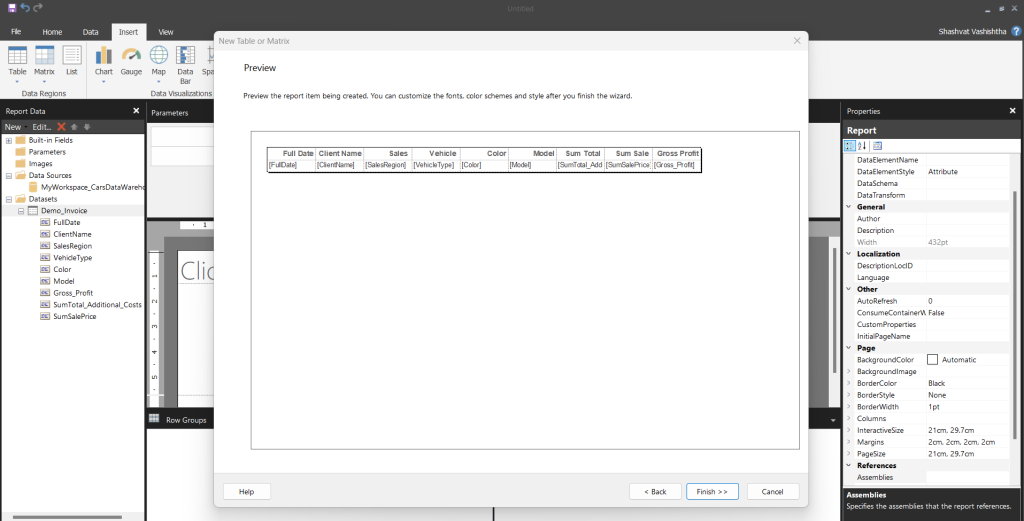
- Select Click to add title to add a title to your report, and format the report columns as needed for a clean, polished look.
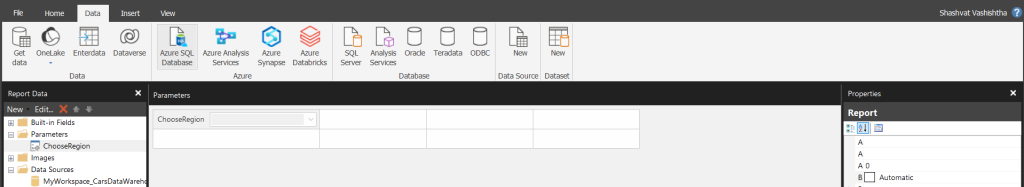
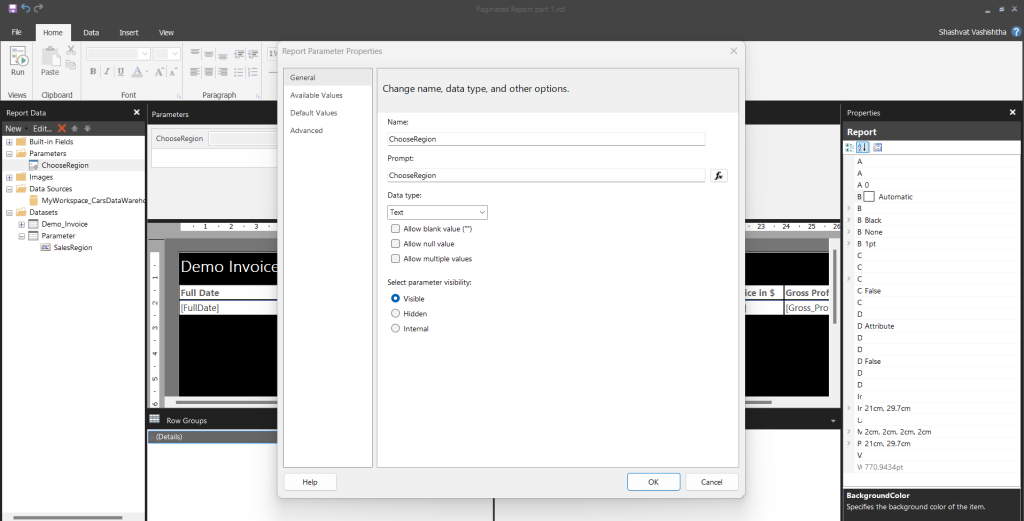
- To add a parameter in Power BI Report Builder, right-click on Parameters in the Report Data pane and select Add Parameter. In the properties window, define the parameter’s attributes and configure its available and default values. After setting it up, use the parameter in your dataset query. Finally, save your report and test the parameter to ensure it functions as intended.
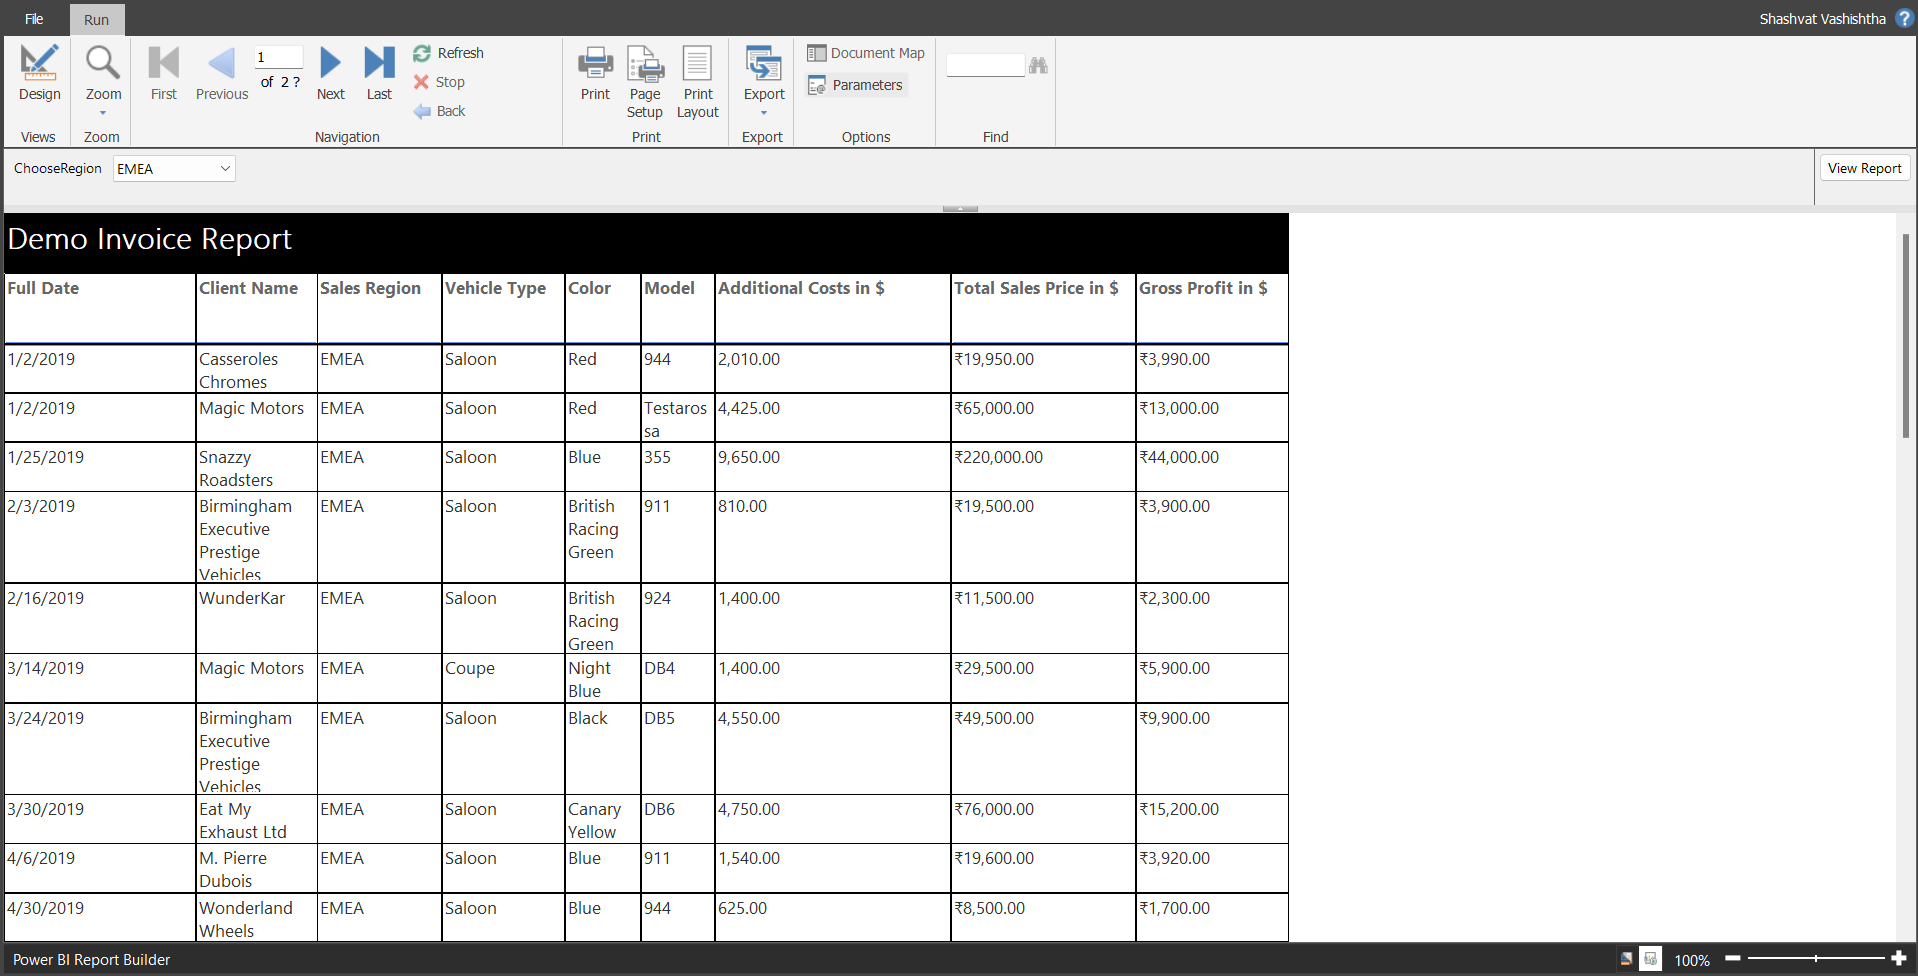
Step 8 – Select Run to preview your report.
Step 9 – Publishing a Paginated Report
Publishing a paginated report from Power BI Report Builder is similar to publishing a report from Power BI Desktop. You can use the Publish button in the Home tab to complete the process.
With the process outlined above, we can create paginated reports based on a Power BI shared dataset. In addition to shared datasets, paginated reports in Power BI can be created using various other data sources:
- Direct Query to Data Sources: Connect directly to databases such as Microsoft SQL Server, Azure SQL Database, and Oracle to retrieve and display data in paginated reports.
- Data Source Connections: Utilize data from a variety of sources, including Excel files, XML files, and CSV/Text files.
- Analysis Services: Connect to SQL Server Analysis Services (SSAS) models for multidimensional or tabular data.
- Custom Data Models: Create data models within Power BI Report Builder by defining datasets and queries.
Summary
In this blog, we explored how to create paginated reports using Power BI shared datasets, providing a step-by-step guide to leverage existing data models for detailed, print-ready reporting. By connecting Power BI Report Builder to shared datasets, we can seamlessly integrate and present complex data across multiple pages with precise formatting. This approach ensures consistency between our Power BI Desktop reports and paginated outputs, enhancing both the accuracy and professionalism of our documentation.
Quick links – https://learn.microsoft.com/en-us/power-bi/paginated-reports/paginated-reports-report-builder-power-bi
