
MySQL | Performance Tuning
Performance Tuning
As our data grows in the database, it is always important to view database insights. We’ve been using some complex queries to solve difficult problems without checking how they affect the server performance.
It’s always preferred to frequently visit the performance schema.
USE performance_schema;
Where to Begin With
We want to boost cluster performance but aren’t sure where to begin.
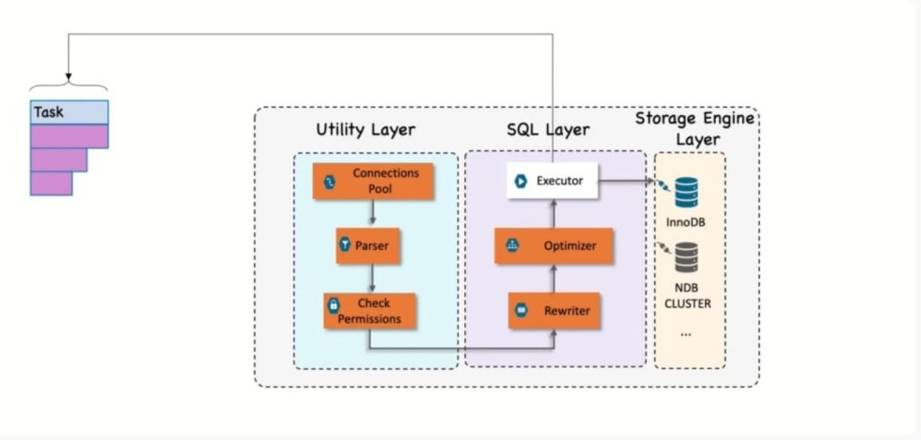
SQL Layer
Why Queries are Slow
- Queries are tasks, and they are composed of subtasks, and those subtasks consume time.
- To optimize the query, we must optimize the subtasks by eliminating them, making them happen fewer times, or making them happen more quickly.
- Talking about the Query life cycle, it’s first parsed, then planned, executed, and finally sent back to the client.
- It involves a lot of calls to the storage engine to retrieve rows and post-retrieval executions such as grouping and sorting.
- While accomplishing the above tasks, the query spends time on the network in the CPU on operations such as statistics, locking, and most importantly, calls to the storage engine to retrieve rows.
- This call consumes time in the memory and the CPU, and especially I/O, if the data is not in memory. Excessive time is consumed because transactions are performed needlessly and too many times, so our goal is to eliminate and reduce the operation by making them faster.
Top 10 Time-Consuming Queries
To optimize the DB, we don’t really need to find the query that is taking the maximum time, but we have to find the query that is taking more time and that is getting called more frequently.
SELECT (100 * SUM_TIMER_WAIT / sum(SUM_TIMER_WAIT) OVER ()) percent, SUM_TIMER_WAIT AS total, COUNT_STAR AS calls, AVG_TIMER_WAIT AS mean, substring(DIGEST_TEXT, 1, 75) FROM performance_schema.events_statements_summary_by_digest ORDER BY SUM_TIMER_WAIT DESC LIMIT 10;
Projection Field Name Description total SUM_TIMER_WAIT Number of times a query has been executed (COUNT_STAR) multiplied by
The average execution time. (AVG_TIMER_WAIT)
mean AVG_TIMER_WAIT Average Response Time substring(DIGEST_TEXT, 1, 75) Query Query
EXPLAIN
List of things expected to happen when the query is executed (list of subtasks).
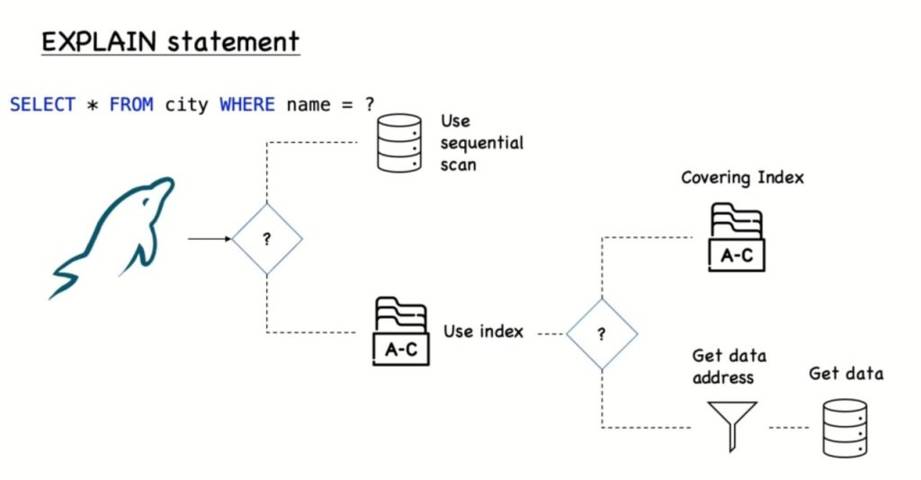
EXPLAIN
EXPLAIN ANALYZE
You will get both the estimation of what the planner expected and what happened when the query ran.
EXPLAIN DELETE from the table won’t delete the actual rows; therefore, it is safe to get the query plan, but EXPLAIN ANALYZE is not just going to show the query plan; it is going to delete those rows.
Understanding how to ANALYZE a query
If we execute the query with EXPLAIN ANALYZE, we will seek all the sub tasks, executing that query. We have to observe which sub task has the biggest jump in the execution time and see if it is justified.
The red flag in EXPLAIN ANALYZE is a large difference between the estimated number of rows and the actual number of rows.
Finding Candidate Queries for the Optimization
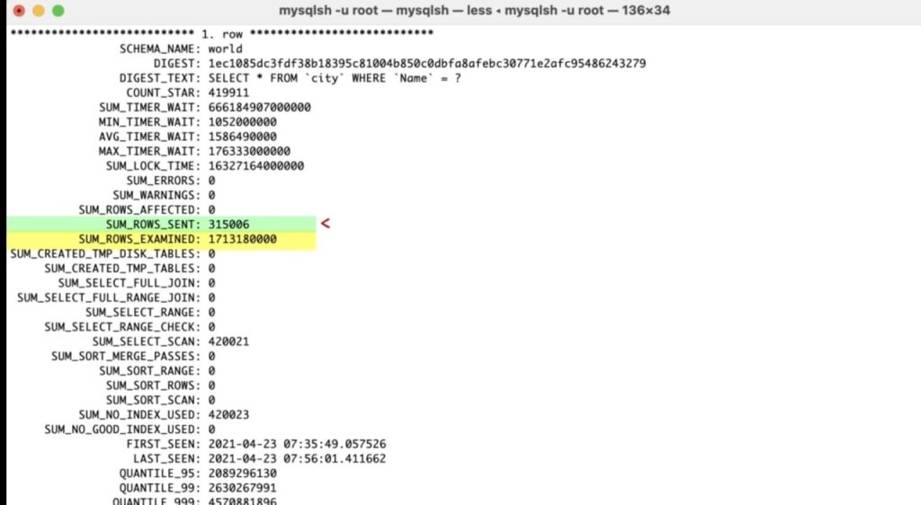
- Large Number of SUM_ROWS_EXAMINED, in comparison to SUM_ROWS_SENT
- This may suggest poor index usage since a large number of rows are sent to the client but discarded afterward.
- If the number of full joins is high, this suggests that either an index is needed or there is a joint condition missing. A full table scan will occur when there is no index for the joint condition and when there is no join condition.
SELECT * FROM sys.statements_with_full_table_scans ORDER BY no_index_used_count DESC\G
-
SUM_ROWS_SENT
- If the number of full joins is high, this suggests that either an index is needed or there is a joint condition missing. A full table scan will occur when there is no index for the joint condition and when there is no join condition.
-
SELECT * FROM sys.statements_with_full_table_scans ORDER BY no_index_used_count DESC\G
-
- When the number of SUM_SELECT_RANGE_CHECK is high, this may suggest that we need to change the indexes on the tables.
- If the number of internal temporary tables created on disk is high, we need to consider which indexes are used for sorting and grouping and the amount of memory allowed for internal temporary tables.
- Writing on disk is still more expensive than internal memory. If you see that the number SUM_SORT_MERGE_PASSES is high for a query (at least as the number of times the query was executed), then increase the sort_buffer_size value only for the sessions that need a larger size.
Check Index Sizes
SELECT TABLE_NAME AS `Table`, ROUND((DATA_LENGTH + INDEX_LENGTH) / 1024 / 1024) AS `Size (MB)` FROM information_schema.TABLES WHERE TABLE_SCHEMA = "test" ORDER BY (DATA_LENGTH + INDEX_LENGTH) DESC;
Some interesting facts that are good to knowledge about
- MySQL’s design separates query processing and other server tasks from data storage and retrieval.
- When we fetch rows from MySQL when using a library, by default the rows are buffered in the library’s memory and then fetched from there.
- The optimizer does not care what storage engine a particular table uses. Still, the storage engine does affect how the server optimizes the query. For example, the optimizer asks the storage engine about some of its capabilities and the cost of certain operations, and for statistics on the table data.
Queries that are creating deadlocks
SELECT * FROM performance_schema.events_errors_summary_by_account_by_error WHERE error_name = 'ER_LOCK_DEADLOCK' \G
Conclusion
events_statements_summary_by_digest in performance_schema is the gold mine when looking for queries that may have performance issues.
Other than performance, we should also consider queries that cause errors and lock time out.
