
Integrating SonarQube with a Maven Project: A Step-by-Step Guide
Introduction
SonarQube is a tool for real-time code analysis developed by SonarSource in January 2008. It supports over 20 programming languages, including Java, Python, and C/C++. The tool helps developers improve code quality by identifying issues such as bugs and code smells and provides tools to address them. SonarQube offers insights into various aspects of code quality, such as architecture, complexity, test coverage, and potential bugs, all accessible through a comprehensive dashboard. It integrates with CI/CD pipelines, development environments like Eclipse and IntelliJ IDEA, and external tools like JIRA. The tool is beneficial for developers, project managers, and higher management, providing a snapshot of current code quality and trends over time. Integrating SonarQube with a Maven project enhances code quality by enabling seamless static code analysis throughout the development process.
Prerequisites
Before we begin, ensure you have the following set up:
- SonarQube Server: A running instance of SonarQube. You can either use a local installation or a hosted service.
- Maven: Installed on your system. Ensure it’s added to your system’s PATH.
- Java: Installed and properly configured.
- Maven Project: A Maven-based Java project ready for SonarQube integration.
Read More: How to setup SonarQube
Install and Configure SonarQube
If you don’t already have a SonarQube server, you can easily install it:
- Download SonarQube from the official SonarQube website.
- Extract the files to a desired location on your machine.
- Start the SonarQube server by navigating to the SonarQube bin directory and running the appropriate startup script for your operating system (e.g., StartSonar.bat for Windows or sonar.sh for Unix/Linux/MacOS).
- To access the SonarQube dashboard, open your web browser and go to the localhost as mentioned below.
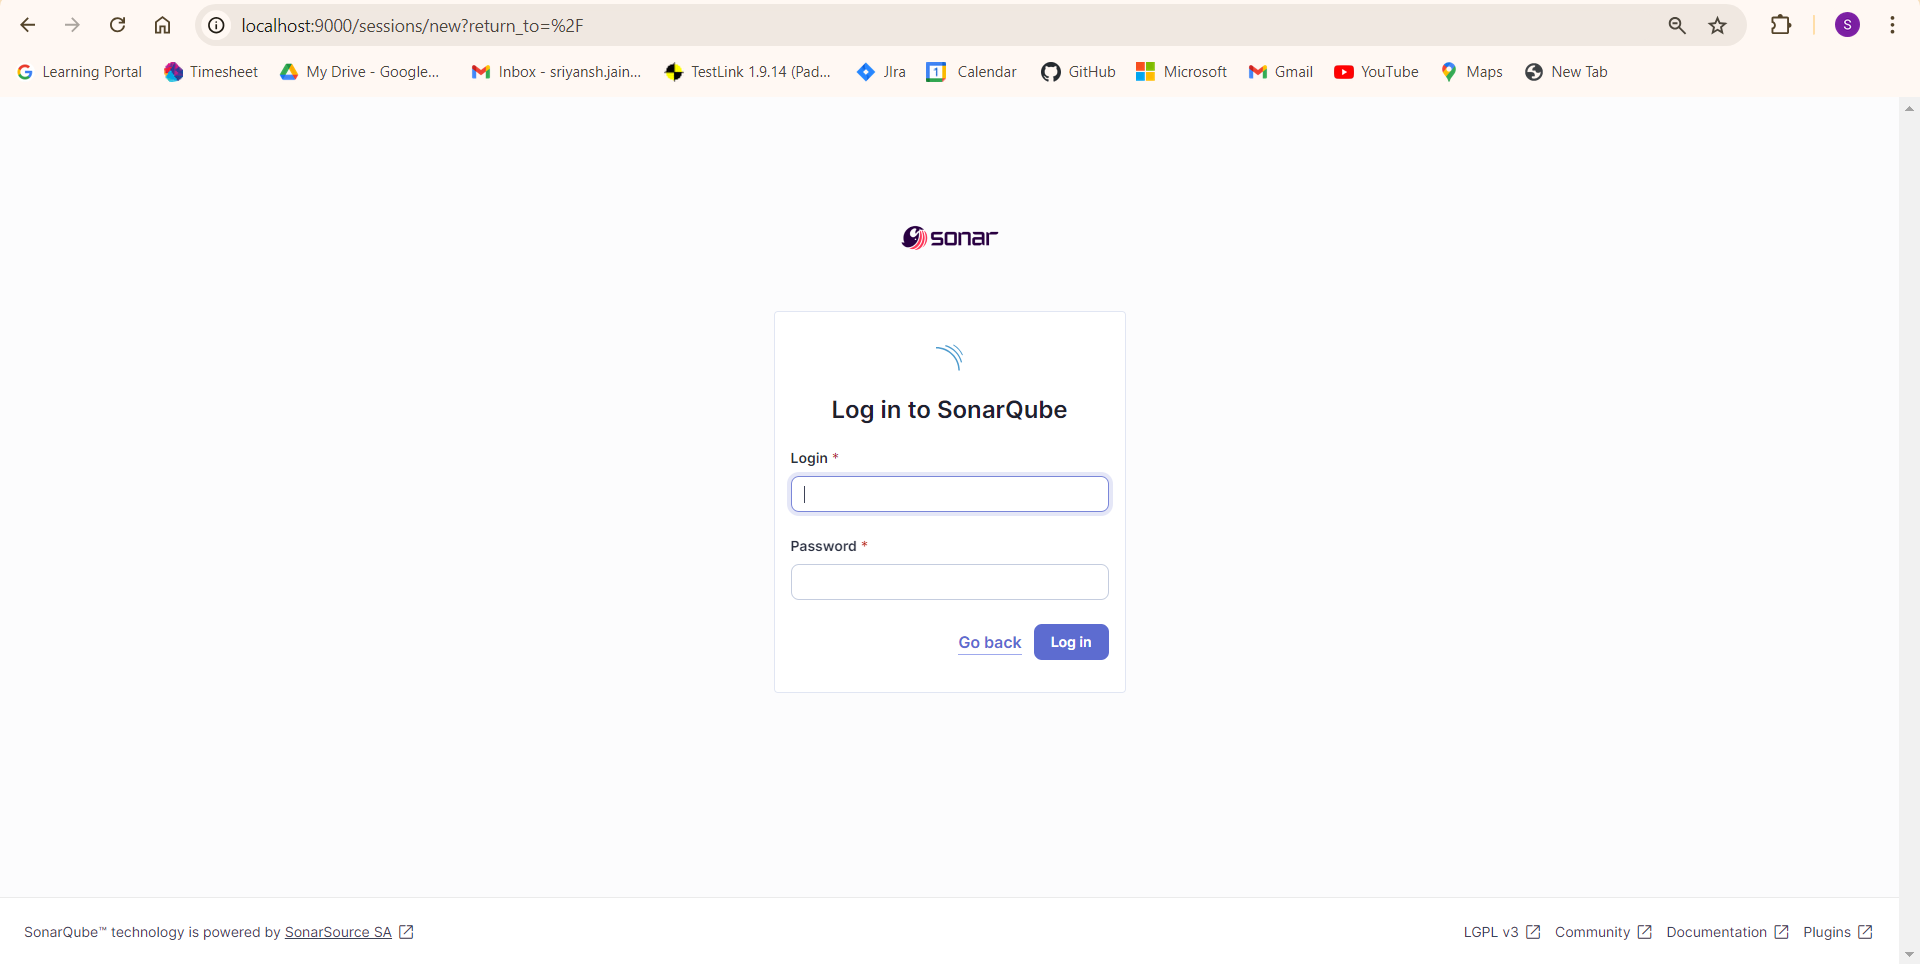
Create a New Project in SonarQube
- Log in to the SonarQube dashboard using the default credentials: admin/admin.
- Create a new project by navigating to the “Projects” tab and selecting “Create a local project.”
- Enter the project name, project key, branch name, and select the global setting to clean as you code.
- Select locally to set up the sonarqube in your project.
- Generate a token for this project. This token will be used to authenticate the Maven build process with SonarQube.

- Copy the token and store it securely, as you’ll need it in the next steps.
Add SonarQube Properties to Your Maven Project
To enable SonarQube analysis during your Maven build, you’ll need to add the SonarQube plugin and properties to your pom.xml file.
- Add the SonarQube plugin in the build section of your pom.xml:

- Configure the SonarQube server URL and project details in the properties section of your pom.xml:

Replace your-project-key with the unique key you set for your project in SonarQube and your-generated-token with the token you generated.
Run SonarQube Analysis
With your Maven project configured, you can now run a SonarQube analysis by simply executing the following Maven command:
mvn clean verify sonar:sonar -Dsonar.token=your-generated-token
Replace your-generated-token with the token you generated.
This command will:
- Clean the project and remove previous builds.
- Verify the build and run all tests.
- Trigger SonarQube analysis and send the results to your SonarQube server.
Accessing SonarQube Reports
Once the analysis is complete, navigate to the SonarQube dashboard to access the reports.
Here’s a breakdown of the key components:
- Overview: Provides a summary of the project’s overall health, including key metrics like code coverage, bugs, and vulnerabilities.
- Issues: Lists all detected issues, categorized by severity (blocker, critical, major, minor, info). You can filter and sort issues to prioritize fixing the most critical ones.
- Measures: Displays detailed metrics such as lines of code, complexity, duplications, and technical debt.
- Code: Allows you to browse through your source code with annotations highlighting detected issues.
Key Metrics and Their Importance
- Bugs: Identifying and addressing defects in the code is crucial to preventing incorrect or unexpected behavior.
- Vulnerabilities: Security weaknesses that could be exploited by attackers.
- Code Smells Maintainability issues that do not necessarily affect functionality but can make the code harder to understand and modify.
- Duplications: Duplicate code blocks that increase maintenance effort.
- Coverage: The unit test code coverage percentage indicates how much of the code is covered by unit tests. Higher coverage typically suggests more thoroughly tested code.
- Complexity: Measures the complexity of the code, which can affect maintainability.
Analyzing and Acting on Reports
- Prioritize Issues: Start by addressing high-severity issues like bugs and vulnerabilities. Use the filters to focus on critical and blocker issues.
- Refactor Code Smells: While they may not be urgent, fixing code smells improves code maintainability.
- Reduce Duplications: Refactor duplicate code to improve maintainability and reduce technical debt.
- Improve Coverage: Write additional tests to increase code coverage, ensuring that critical paths and edge cases are well-tested.
- Manage Technical Debt: Use the technical debt ratio to plan refactoring and improvement efforts.
Generating Reports
SonarQube provides various report generation options, including:
- PDF Reports: Use the SonarQube PDF plugin to generate comprehensive PDF reports.
- Custom Dashboards: Create custom dashboards within SonarQube to focus on the metrics most relevant to your project.
- APIs: SonarQube offers REST APIs that allow you to extract metrics and integrate them into external reporting tools.
Automate the Analysis in CI/CD Pipelines
To unlock the full potential of SonarQube, consider seamlessly integrating it into your CI/CD pipeline. By doing so, every code change will be automatically analyzed, ensuring continuous code quality monitoring.
Read More: Integrating SonarQube with Jenkins
For Jenkins, for example, you can add the mvn clean verify sonar:sonar -Dsonar.token=your-generated-token command as a build step in your Jenkins pipeline configuration. Other CI/CD tools like GitLab CI, CircleCI, and Travis CI can similarly be configured to include SonarQube analysis as part of the build process.
Conclusion
Integrating SonarQube with your Maven project is a straightforward process that can greatly enhance your code quality by providing continuous insights and feedback. By following the steps outlined in this guide, you can ensure that your codebase is continuously monitored for potential issues, leading to more robust and maintainable software.
Start integrating SonarQube today to take your code quality to the next level!
