Introduction
Monitoring is a crucial aspect of managing cloud environments, ensuring that you can track the health, performance, and reliability of your infrastructure. Prometheus and Grafana are powerful tools commonly used for monitoring and visualization. Prometheus excels at collecting and querying metrics, while Grafana provides an interface for visualizing this data through customizable dashboards.
Using AWS EC2 to host these tools offers flexibility and scalability, making it an ideal choice for setting up a robust monitoring solution.
Prerequisites
Before diving into the setup, ensure you have the following:
- AWS EC2 Instance: An active AWS account and an EC2 instance running Amazon Linux 2.
- Basic Knowledge: Familiarity with Linux commands and basic AWS services.
- Tools Needed: An SSH client to connect to your EC2 instance and AWS CLI for managing AWS resources.
Note: This blog is based on the setup of Grafana and Prometheus on Amazon Linux 2, you can also use other OS versions as per your needs.
Setting Up the EC2 Instance
Launching an EC2 Instance:
- Log in to your AWS Console and navigate to the EC2 dashboard.
- Launch a new instance by selecting “Launch Instance.”
- Choose Amazon Linux 2 as the Amazon Machine Image (AMI).
- Select an Instance Type: T2.small is sufficient for basic monitoring needs or if you want you can go for higher instance type.
- Configure Security Groups: Allow inbound traffic for SSH (port 22), HTTP (port 80), HTTPS (port 443), and custom ports for Prometheus (9090) and Grafana (3000).
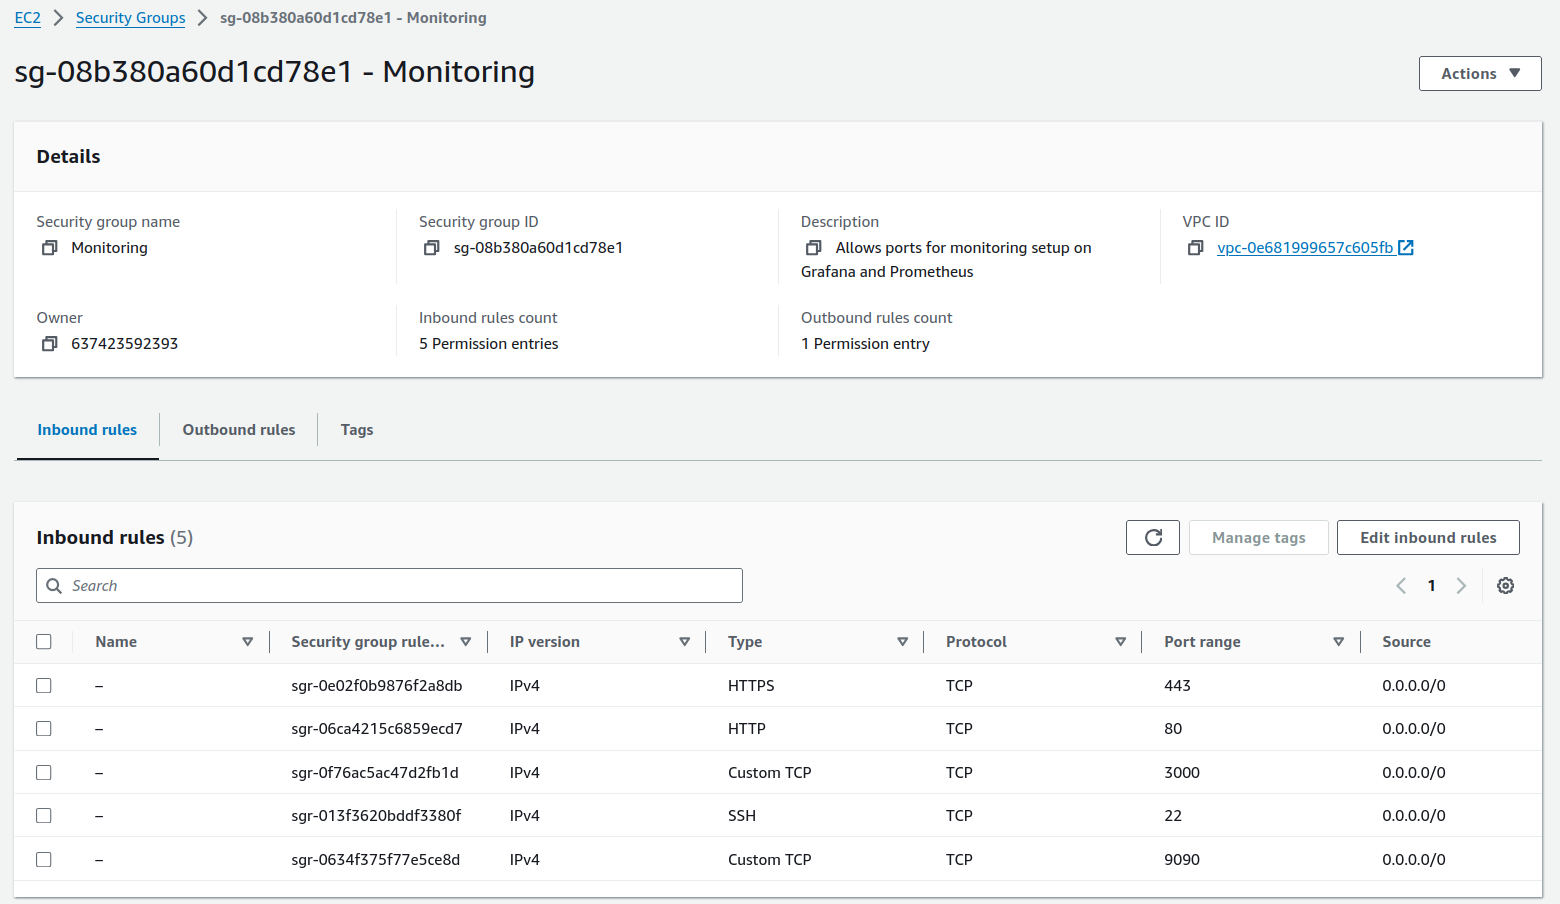
Security Group
- Launch the Instance and download the key pair for SSH access.
Connecting to the Instance:
- SSH into your EC2 instance using the downloaded key pair:
ssh -i your-key.pem ec2-user@your-ec2-public-ip - Update the package list and install essential packages:
sudo yum update -y
sudo yum install git wget -y
Installing and Configuring Prometheus on Amazon Linux 2
Step-by-Step Installation of Prometheus:
- Create a system user for Prometheus:
sudo useradd --no-create-home --shell /bin/false prometheus - Create directories for Prometheus configuration and data:
sudo mkdir /etc/prometheus sudo mkdir /var/lib/prometheus - Set the ownership of the data directory:
sudo chown prometheus:prometheus /var/lib/prometheus - Move to the /tmp directory:
cd /tmp/ - Download Prometheus:
wget https://github.com/prometheus/prometheus/releases/download/v2.31.1/prometheus-2.31.1.linux-amd64.tar.gz - Extract the downloaded Prometheus package:
tar -xvf prometheus-2.31.1.linux-amd64.tar.gz - Move to the extracted directory:
cd prometheus-2.31.1.linux-amd64 - Move configuration files and set ownership:
sudo mv console* /etc/prometheus sudo mv prometheus.yml /etc/prometheus sudo chown -R prometheus:prometheus /etc/prometheus - Move binaries and set ownership:
sudo mv prometheus /usr/local/bin/
sudo chown prometheus:prometheus /usr/local/bin/prometheus
Creating Prometheus Systemd Service:
- Create a systemd service file for Prometheus:
sudo nano /etc/systemd/system/prometheus.service - Add the following content:
[Unit]
Description=Prometheus
Wants=network-online.target
After=network-online.target

[Service]
User=prometheus
Group=prometheus
Type=simple
ExecStart=/usr/local/bin/prometheus \
    --config.file /etc/prometheus/prometheus.yml \
    --storage.tsdb.path /var/lib/prometheus/ \
    --web.console.templates=/etc/prometheus/consoles \
    --web.console.libraries=/etc/prometheus/console_libraries

[Install]
WantedBy=multi-user.target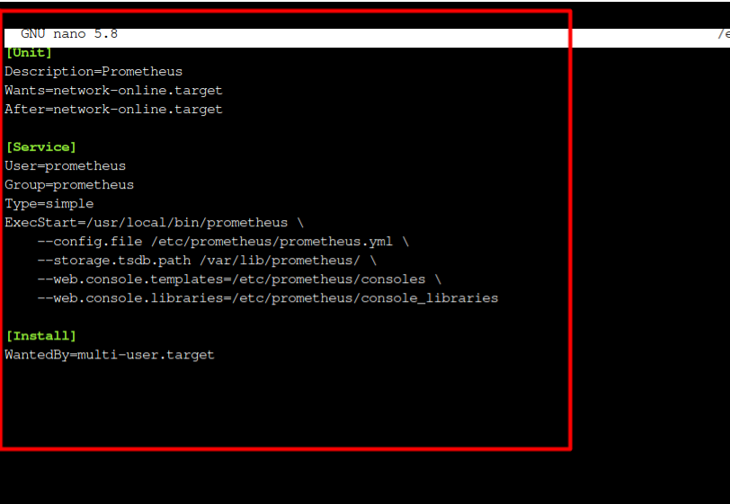
Prometheus Service
- Reload systemd to apply the new service:
sudo systemctl daemon-reload - Enable and start Prometheus service:
sudo systemctl enable prometheus sudo systemctl start prometheus - Check if the Prometheus Service is running
sudo systemctl status prometheus
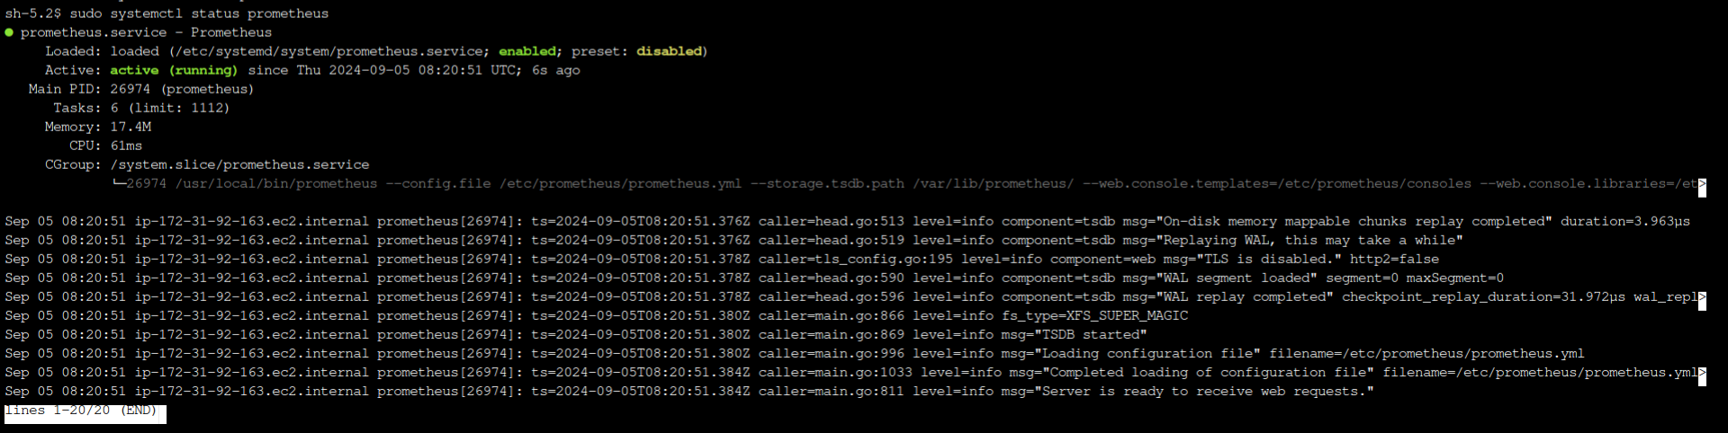
Prometheus Status
Testing Prometheus:
Access Prometheus UI: Open your browser and go to http://your-ec2-public-ip:9090 to verify that Prometheus is running.
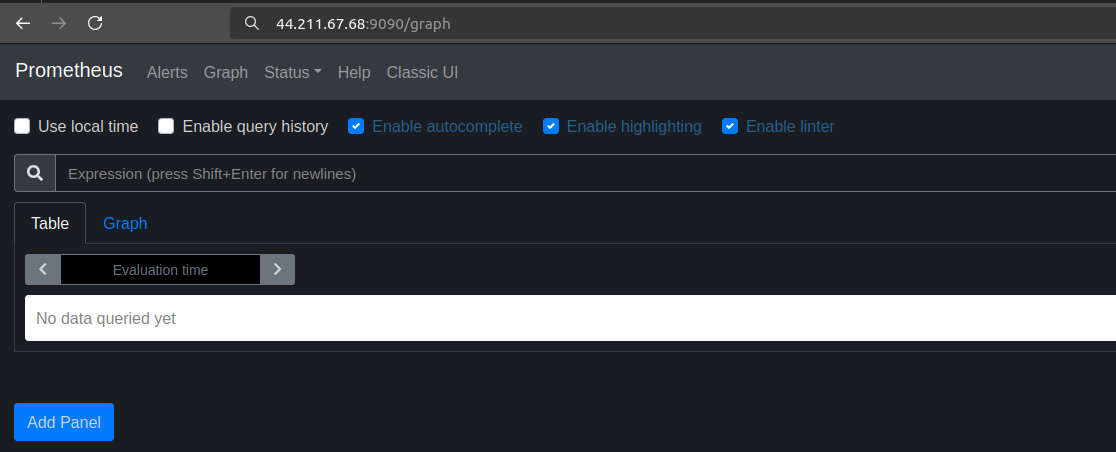
http://your-ec2-public-ip:9090
Step-by-Step Installation of Node Exporter:
- Go to the Prometheus download page:
http://prometheus.io/download - Copy the Node Exporter download link:
wget https://github.com/prometheus/node_exporter/releases/download/v1.5.0/node_exporter-1.5.0.linux-amd64.tar.gz - Extract the downloaded file:
tar xvf node_exporter-1.5.0.linux-amd64.tar.gz - Move into the extracted Node Exporter directory:
cd node_exporter-1.5.0.linux-amd64/ - Start Node Exporter by running the executable:
./node_exporterYou will see Node Exporter listening on port 9100.
- Check if Node Exporter is running:
curl localhost:9100/metrics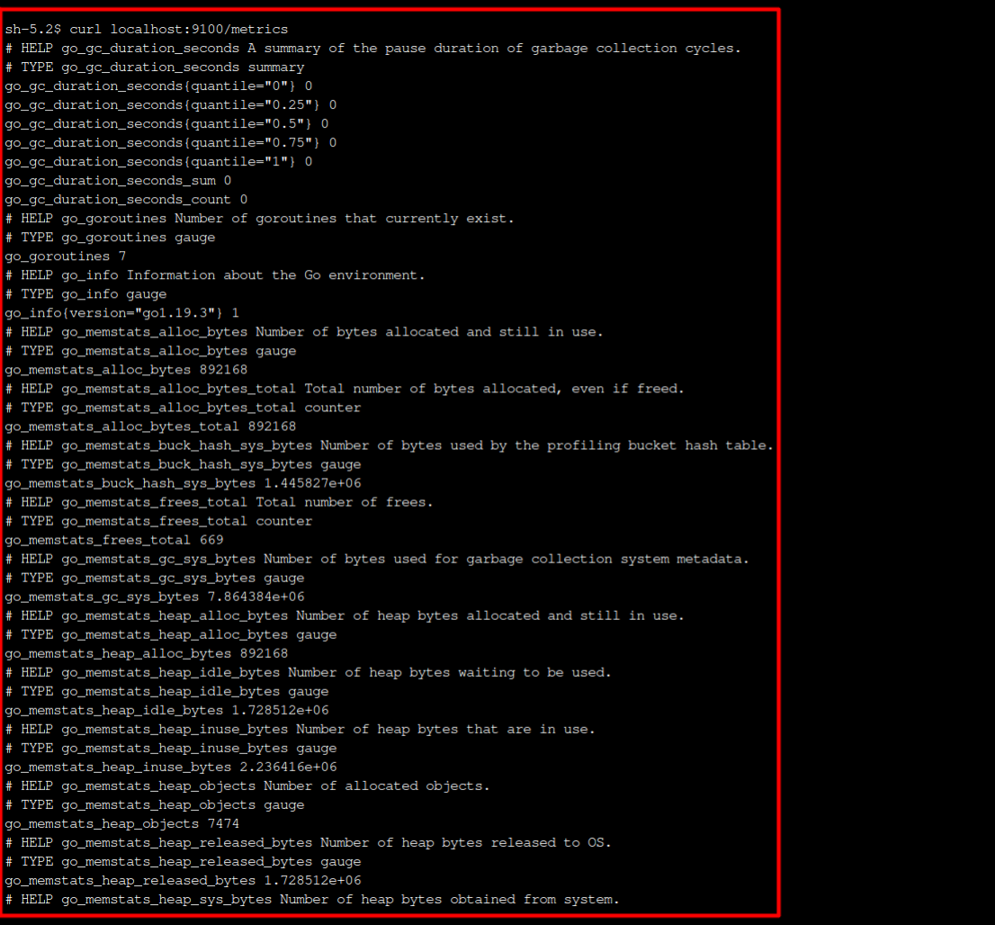
curl localhost:9100/metrics
Alternatively, visithttp://your-ec2-public-ip:9100/metricsfrom a browser.
Setting Up Node Exporter as a Service:
To ensure that Node Exporter runs as a background service and starts automatically on reboot, follow the steps below:
- Copy Node Exporter binary to /usr/local/bin:
sudo cp node_exporter /usr/local/bin - Create a system user for Node Exporter:
sudo useradd node_exporter --no-create-home --shell /bin/false - Change ownership of the Node Exporter binary:
sudo chown node_exporter:node_exporter /usr/local/bin/node_exporter - Create a systemd service file for Node Exporter:
sudo nano /etc/systemd/system/node_exporter.service - Add the following content to the service file:
[Unit] Description=Node Exporter Wants=network-online.target After=network-online.target [Service] User=node_exporter Group=node_exporter Type=simple ExecStart=/usr/local/bin/node_exporter [Install] WantedBy=multi-user.target - Reload systemd:
sudo systemctl daemon-reload - Start and enable Node Exporter as a service:
sudo systemctl start node_exporter sudo systemctl enable node_exporter - Check the status of the Node Exporter service:
sudo systemctl status node_exporter
Adding Targets in prometheus.yml
Configuring Prometheus to Scrape Node Exporter Metrics-
- Edit the prometheus.yml file:
sudo nano /etc/prometheus/prometheus.yml - Add the Node Exporter targets under scrape_configs:
scrape_configs:
  - job_name: 'node_exporter'
    static_configs:
      - targets: ['localhost:9100']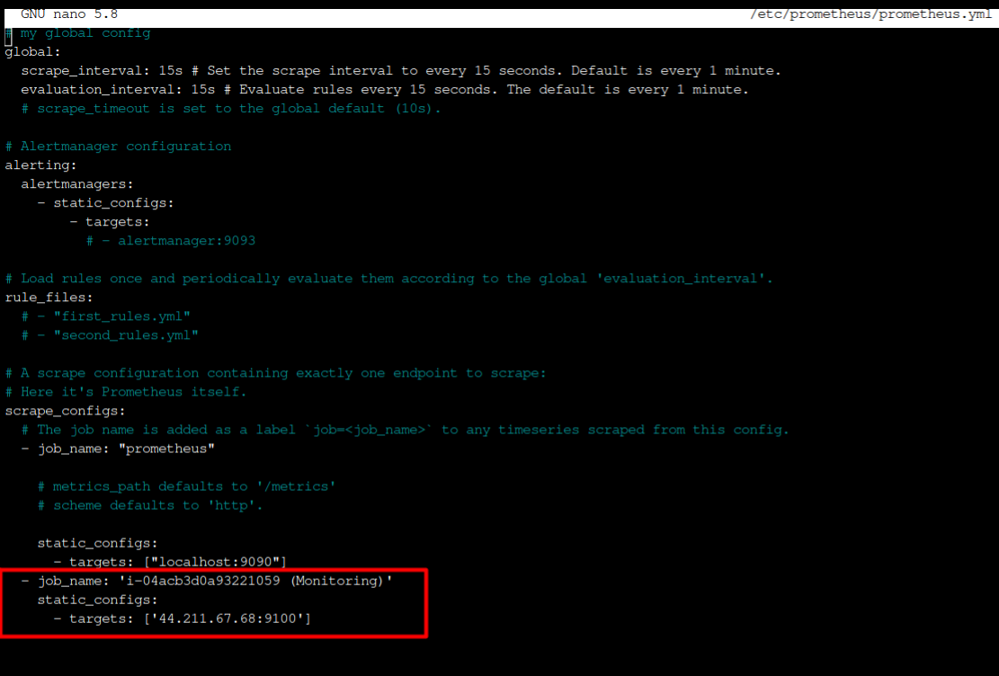
prometheus.yml
Note: Replacelocalhost:9100with the actual IP and port if you are scraping multiple EC2 instances and allow port on instances for Prometheus. So, that the metrics can be scarped by Prometheus. - Restart Prometheus to apply the changes:
sudo systemctl restart prometheus - Verify targets in Prometheus UI:
visit http://your-ec2-public-ip:9090/targets from a browser.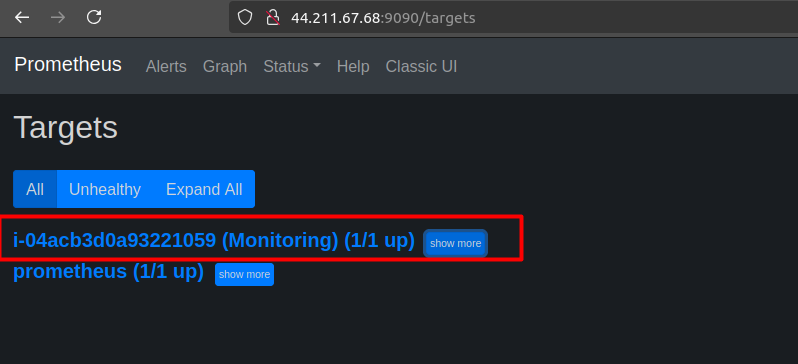
http://your-ec2-public-ip:9090/targets
Installing and Configuring Grafana
Setting Up Grafana:
We will first add the Grafana repository so that the system knows where to retrieve it:
- Create a repository file for Grafana:
sudo nano /etc/yum.repos.d/grafana.repo - Add the following content to the repository file:
[grafana] name=grafana baseurl=https://packages.grafana.com/oss/rpm repo_gpgcheck=1 enabled=1 gpgcheck=1 gpgkey=https://packages.grafana.com/gpg.key sslverify=1 sslcacert=/etc/pki/tls/certs/ca-bundle.crt - Install Grafana:
sudo yum install grafana -y - Reload the systemd manager configuration:
sudo systemctl daemon-reload - Start the Grafana server:
sudo systemctl start grafana-server - Check the status of the Grafana service:
sudo systemctl status grafana-server - Enable Grafana to start on boot:
sudo systemctl enable grafana-server.service
Testing Grafana:
To test Grafana, open your browser and visit your EC2 instance’s public IP followed by :3000 (e.g., http://your-ec2-public-ip:3000).
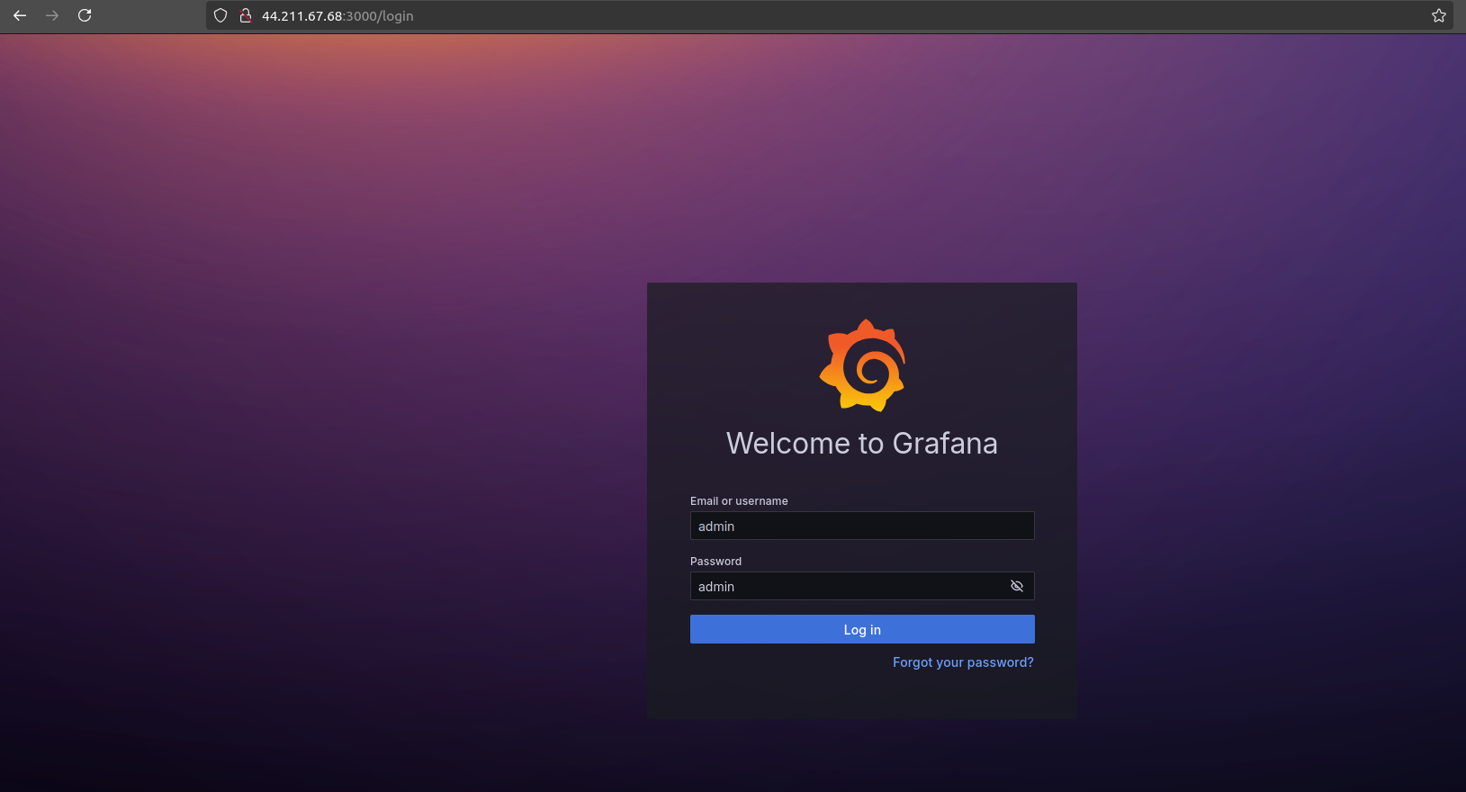
http://your-ec2-public-ip:3000
Log in with the default credentials: Username: admin and Password: admin. You will be prompted to set a new password.
Installing and Configuring Nginx:
- Install Nginx on your EC2 instance:
sudo yum install nginx -y - Obtain an SSL certificate: Use Let’s Encrypt for a free SSL certificate.
- Install Certbot:
sudo yum install certbot python3-certbot-nginx -y - Request an SSL certificate:
sudo certbot --nginx -d your-domain.com -d www.your-domain.com - Follow the prompts to complete the SSL setup.
- Install Certbot:
- Configure Nginx to redirect HTTP to HTTPS and proxy traffic to Grafana:
sudo nano /etc/nginx/nginx.confAdd the following server block:
server {
    listen 80;
    server_name your-domain.com www.your-domain.com;
    return 301 https://$host$request_uri;
}

server {
    listen 443 ssl;
    server_name your-domain.com www.your-domain.com;

    ssl_certificate /etc/letsencrypt/live/your-domain.com/fullchain.pem;
    ssl_certificate_key /etc/letsencrypt/live/your-domain.com/privkey.pem;

    location / {
        proxy_pass http://localhost:3000;
        proxy_set_header Host $host;
        proxy_set_header X-Real-IP $remote_addr;
        proxy_set_header X-Forwarded-For $proxy_add_x_forwarded_for;
        proxy_set_header X-Forwarded-Proto $scheme;
    }
}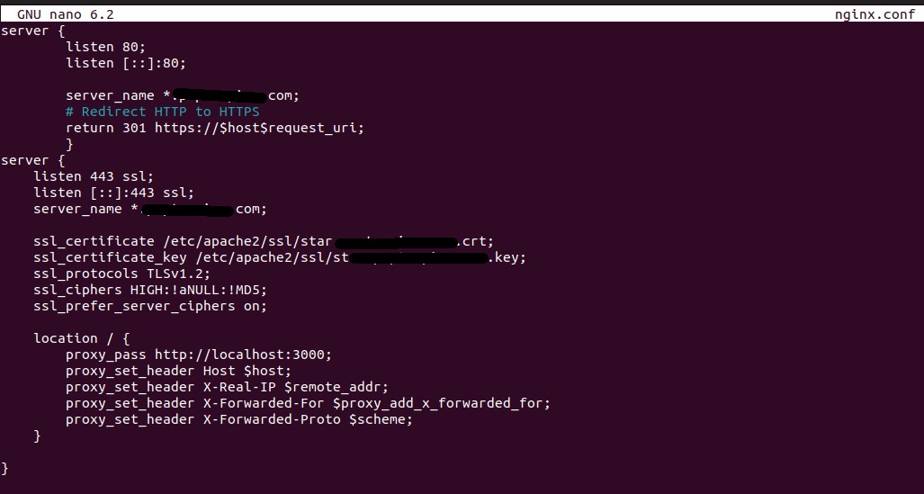
nginx.conf
- Restart Nginx to apply the changes:
sudo systemctl restart nginx
Adding a DNS Entry on Route 53
Setting Up Route 53:
- Navigate to Route 53 in the AWS Management Console.
- Create a new hosted zone for your domain if you haven’t already.
- Add an A Record:
- Choose your hosted zone and click “Create Record.”
- Set the record type to A – IPv4 address.
- Enter your domain name and the public IP of your EC2 instance.
- Enable “Alias” if you’re using an AWS Load Balancer (optional).
- Save the Record and wait for DNS propagation.
Creating and Customizing Dashboards
Connecting Prometheus Data Source:
- Add Prometheus as a data source in Grafana:
- Navigate to Configuration > Data Sources > Add data source.
- Choose Prometheus and set the URL to
http://localhost:9090. - Click Save & Test to ensure the connection works.
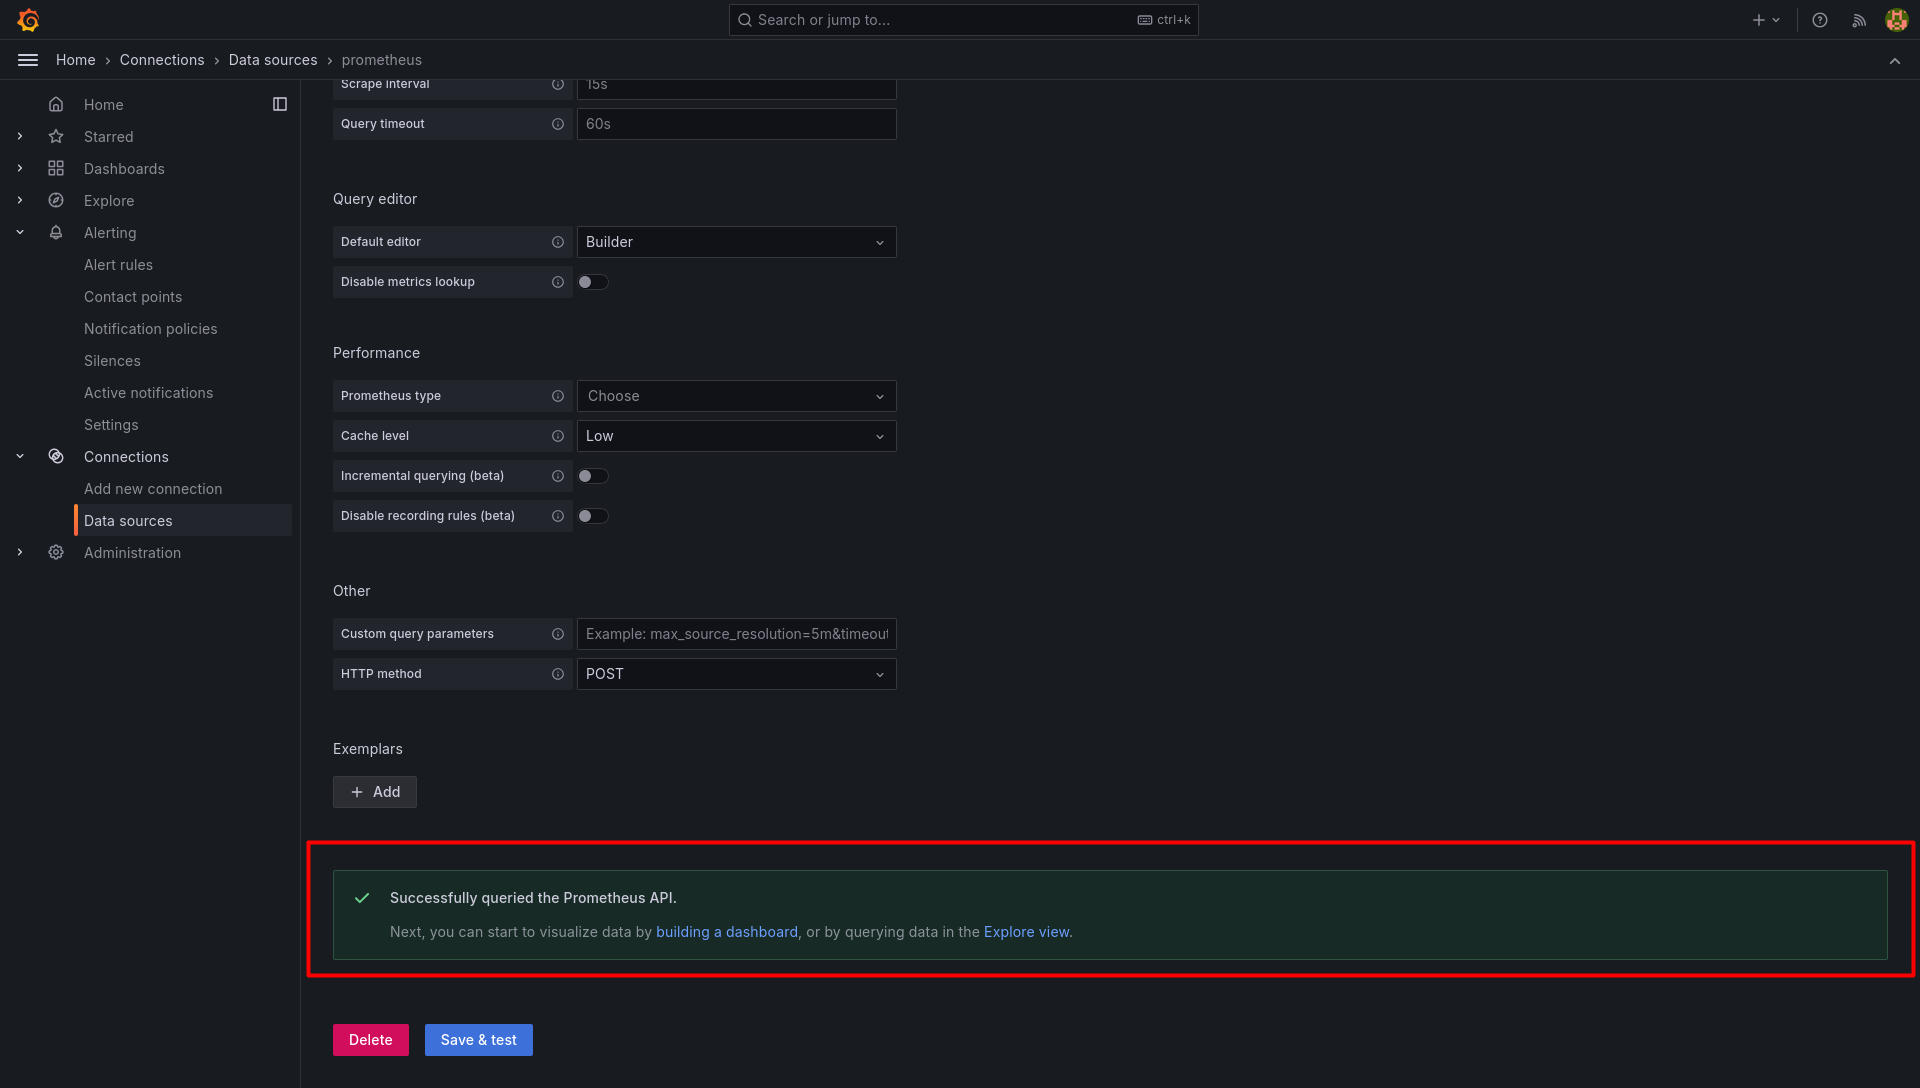
connection works.
Creating Dashboards:
- Create a new dashboard:
- Go to Create > Dashboard > Add New Panel.
- Select Prometheus as the data source and write queries to monitor CPU, memory, and disk usage.
- Customize panels with various visualization options or import pre-build dashboard’s from https://grafana.com/grafana/dashboards/
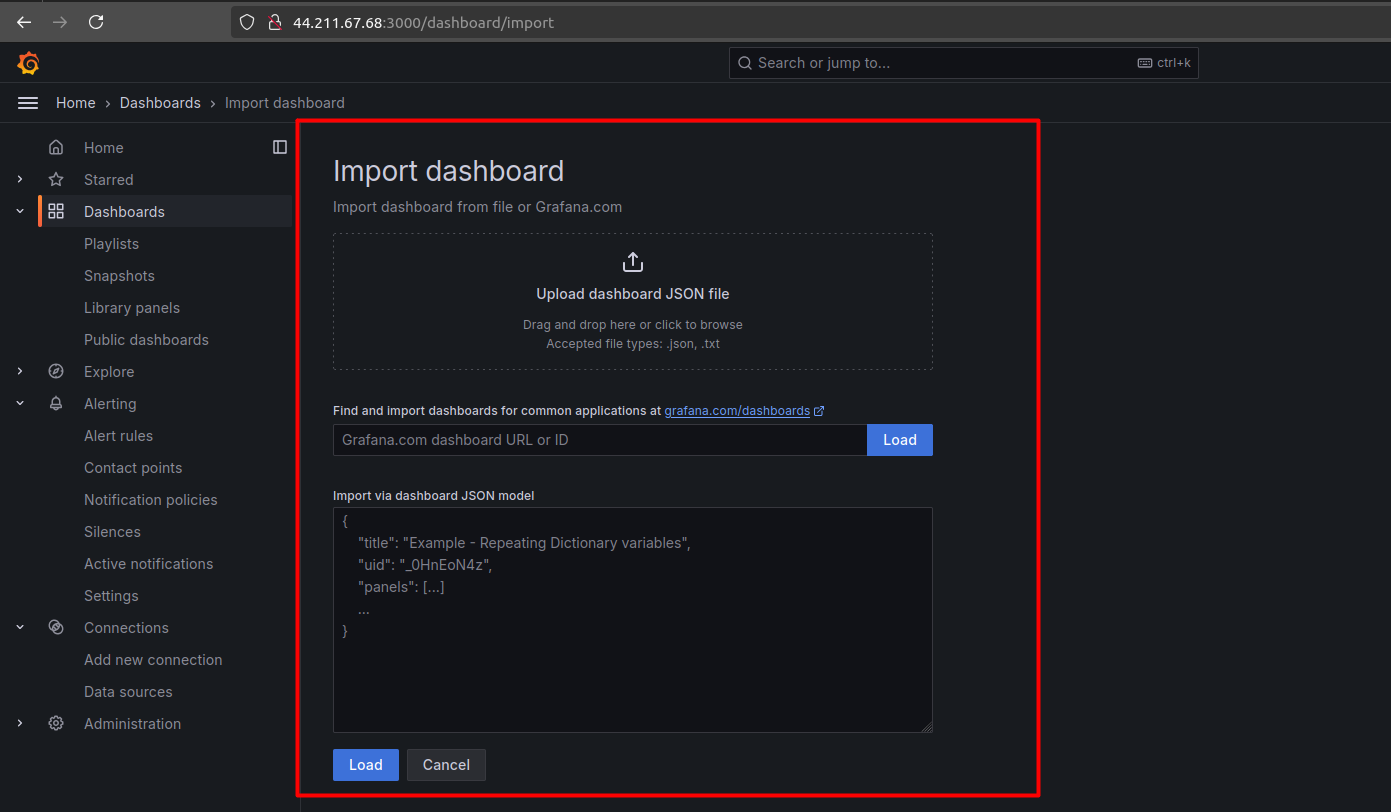
http://your-ec2-public-ip:3000/dashboard/import
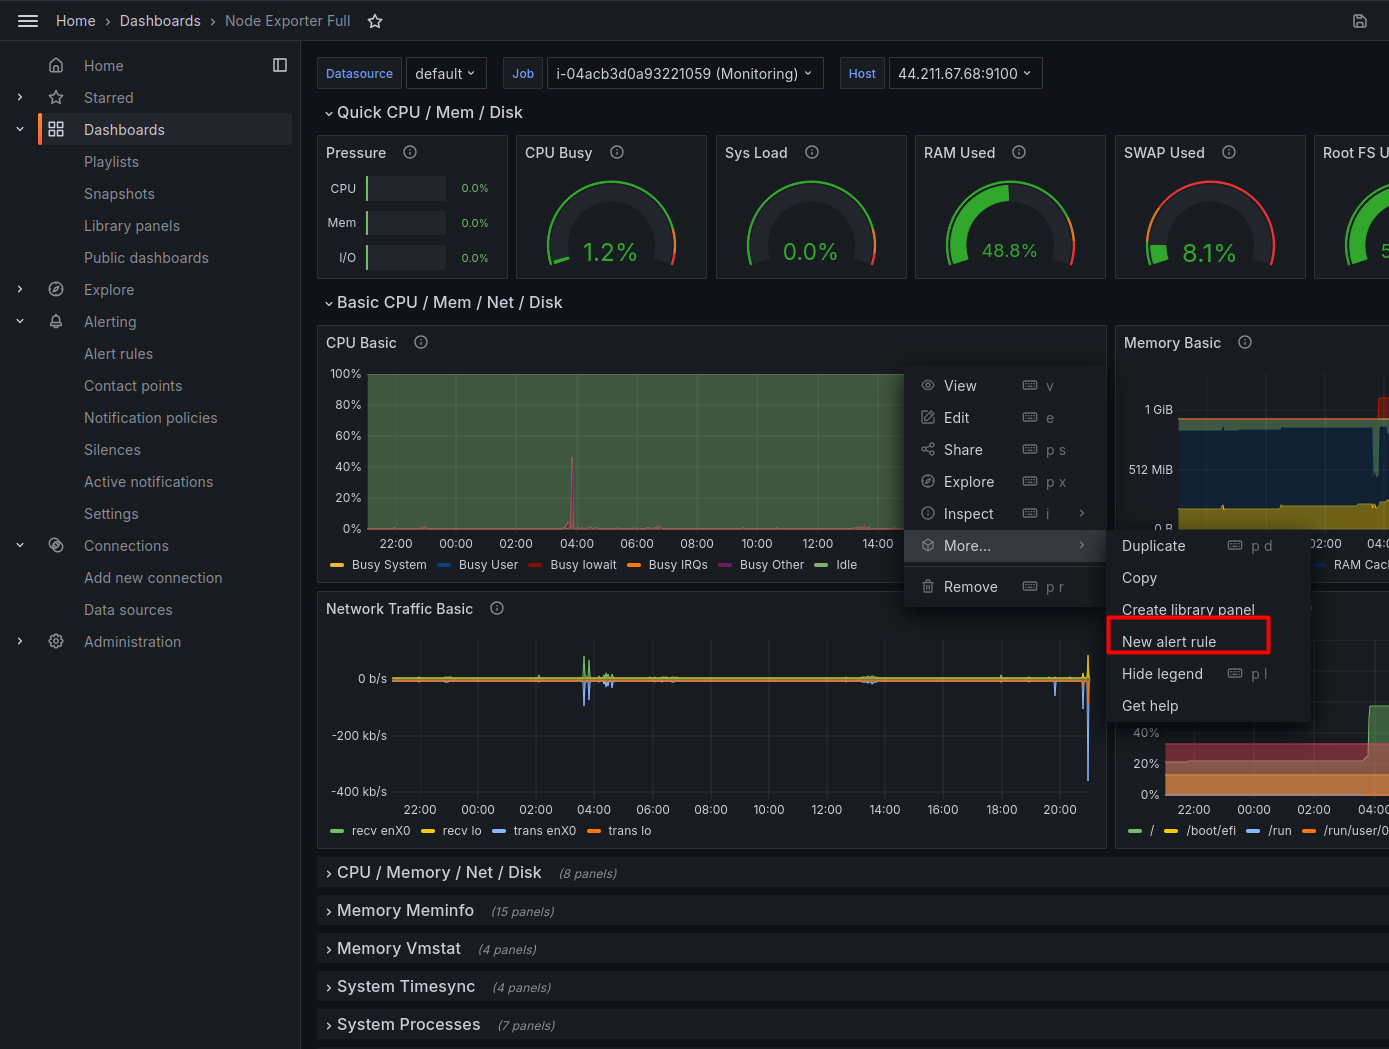
Below is the Node Exporter Full Dashboard with ID – 1860, imported from Grafana’s website (https://grafana.com/grafana/dashboards/).
Link of the Dashboard – https://grafana.com/grafana/dashboards/1860-node-exporter-full/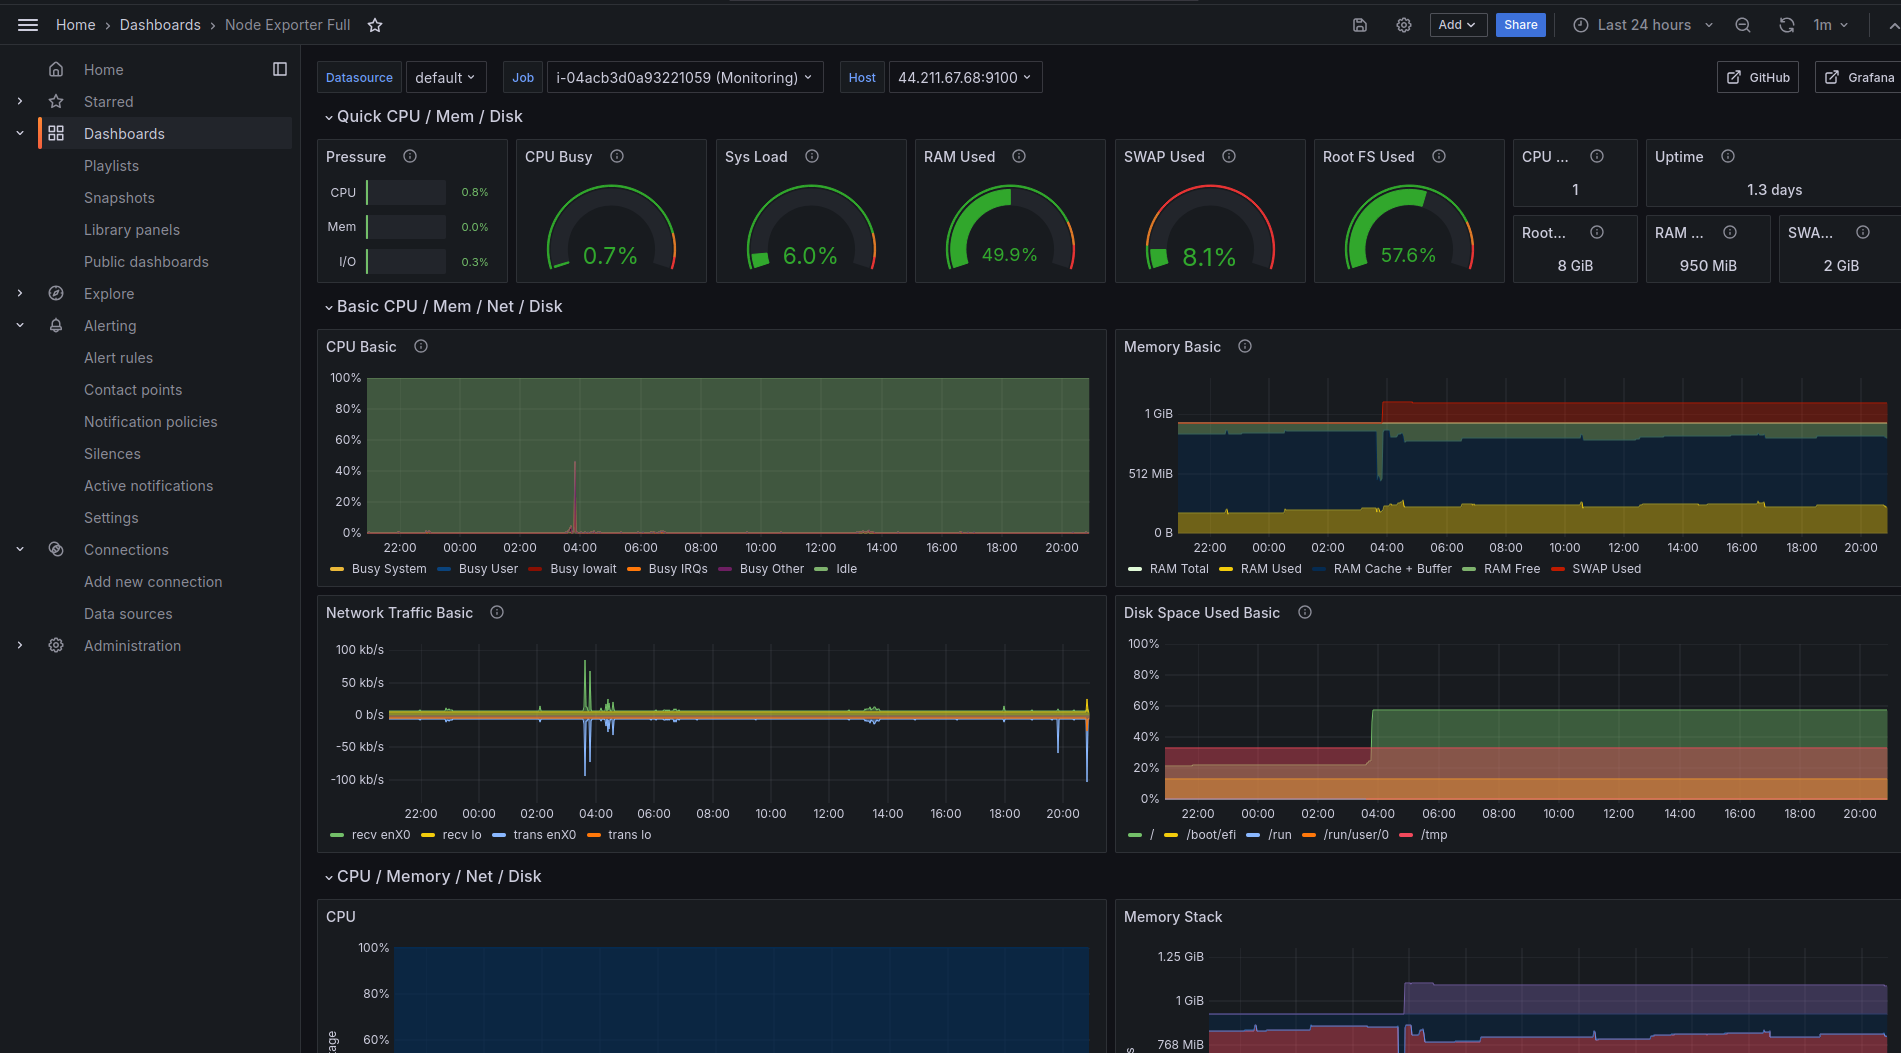
Noe Exporter Full
Setting Up Alerts in Grafana:
- Create an alert rule:
- Navigate to a dashboard in the Dashboards section.
- In the top right corner of the panel, click on the three dots (ellipses).
- From the dropdown menu, select More… and then choose New alert rule.
- Define the conditions (e.g., trigger an alert when CPU usage exceeds 80%).
- Set up the evaluation interval (how frequently the alert should be checked).
- Configure alert notifications:
- Define Contact Points: Set up your contact points, which are integrations (e.g., email, Slack) to deliver notifications.
- Create a Notification Policy: Define a notification policy to set rules for routing alerts to your contact points. In this policy, decide when and where alerts should be sent based on their importance or criteria.
- Add Notification Templates (Optional): Use templates to create consistent messaging for your notifications across different contact points.
Conclusion
Setting up monitoring with Grafana and Prometheus on an AWS EC2 instance, secured with Nginx and integrated with Route 53 for DNS management, provides a scalable and flexible solution for tracking the health and performance of your infrastructure. This guide walked you through the setup process, from launching an EC2 instance to configuring Prometheus and Grafana, installing Node Exporter, setting up Nginx for SSL termination, configuring alerts in Grafana, and securing your setup. With these tools in place, you can gain valuable insights into your system’s performance and be alerted to any issues before they become critical.
Observability stacks like Grafana and Prometheus are no longer optional — they are foundational to running reliable digital products in production. Embedding monitoring and alerting from the start is a key practice in product engineering services, ensuring issues are caught before they impact users.