
A guide on Optimising and Improving your Flutter app Memory performance by Using Flutter Dev Tools
Introduction of Dev tools in Flutter
Flutter Dev tool provides an in-depth analysis of App performance from UI to CPU and memory usage of the app. Flutter provides a Profiling tool which can help in better understanding our apps run time performance. To use profiling tools following conditions needs to be taken in consideration –
- Debugging should be conducted on physical devices(iOS/Android)
- Debugging device should be the device with the lowest hardware support that most of the users might reasonably use.
- The app should run in Profile mode rather than debug
- Once the app is running in the designated mode use dev tools to launch our needed tools.
How to Use Dev tools
- Once the app is launched use the ‘Open Flutter Dev Tools’ button in the debugger.
- On the tool window the currently running app can be seen as the connected app, if not the process can be linked with the tool here.
- We can see multiple tabs that can be used to analyze our app when it’s running.

Tool Bar
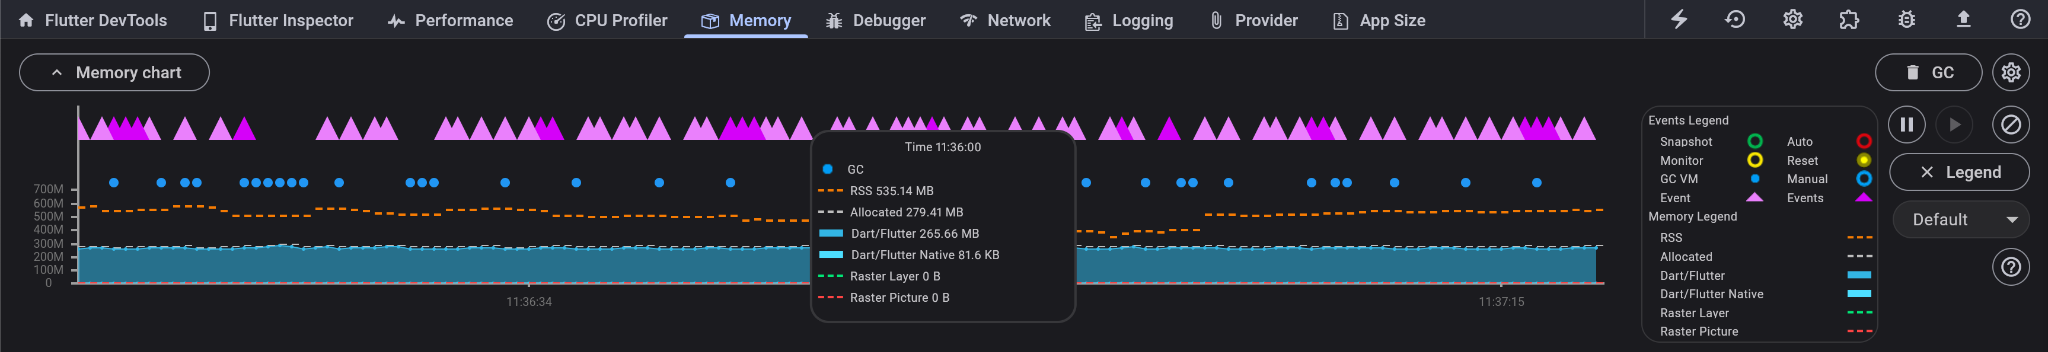
- Memory View – The memory tools is necessary to help us identify issues in the memory utilisation by our app which may lead to crash, slow/unresponsive API, to identify suspected memory leaks. This tool provides a time series graph of the current memory usage. The X-axis shows timeline of events every 500ms. From the event legend we can see what each icon on the graph indicates. We can hover over/select a particular point along the X axis to fine the detailed view of what happened in the memory at that time instance. Details of the points on Y-axis are as below –
- Dart/Flutter Heap – Objects (Dart and Flutter objects) in the heap.
- Dart/Flutter Native – Memory that isn’t in the Dart/Flutter heap but is still part of the total memory footprint. Objects in this memory would be native objects (for example, from reading a file into memory, or a decoded image). The native objects are exposed to the Dart VM from the native OS (such as Android, Linux, Windows, iOS) using a Dart embedder.
- Timeline – The timestamps of all collected memory statistics and events at a particular point in time (timestamp).
- Raster Cache – The size of the Flutter engine’s raster cache layer(s) or picture(s), while performing the final rendering after compositing.
- Allocated – The current capacity of the heap is typically slightly larger than the total size of all heap objects.
- RSS(Resident Set Size) – The resident set size displays the amount of memory for a process. It doesn’t include memory that is swapped out. It includes memory from shared libraries that are loaded, as well as all stack and heap memory.
Memory View
Apart from the timeline view, Tool also provides in-depth analysis in 3 sub-tabs namely –
-
-
- Profile Memory – This view shows the memory allocation by class i.e. memory allocated/used by each class. To view the memory allocation in real-time select ‘Refresh on GC’ ( this refreshes the page too frequently, to avoid this use ‘Refresh’ when you want to view the memory table.)

Profile memory View
- Diff Snapshot Tab – We need to follow the steps mentioned under this tab to capture the memory snapshot at an instance. Once the snapshot is captured we can see the different classes and memory allocation under each class when the snapshot was captured. This table can be filtered or the cells(each table cell represents a class) be selected to see the instances for each class and memory allocation. The path can also be selected to find additional information for that instance.

Capturing Memory Snapshot
- Trace Instance – Use the Trace Instances tab to investigate what methods allocate memory for a set of classes during feature execution:
- Select classes to trace
- Interact with your app to trigger the code you are interested in
- Tap Refresh
- Select a traced class
- Review the collected data
- Profile Memory – This view shows the memory allocation by class i.e. memory allocated/used by each class. To view the memory allocation in real-time select ‘Refresh on GC’ ( this refreshes the page too frequently, to avoid this use ‘Refresh’ when you want to view the memory table.)
-
- Network View – This view allows us to see the HTTP, HTTPS, and web socket traffic from our Application. We can select any network call from the left table and see an in-depth analysis on the right table. We can see the Headers, Response, Request as well as cookies related to each network call. In over view section, we can see Timing which shows a horizontal bar that when we hover over will tell us the Waiting time, connection establish time, and content download time.
The filter query syntax is described in the dialog. You can filter network requests by the following keys:
-
-
- method, m: this filter corresponds to the value in the “Method” column
- status, s: this filter corresponds to the value in the “Status” column
- type, t: this filter corresponds to the value in the “Type” column
-
These queries can be used to narrow down a network call search better. Like we can search for ‘status:404‘ to get network calls that return status 404.
We can also use this to understand all the network calls made when our app starts, this will help us to understand if network call is the reason our app takes a lot of time to startup. The steps to achieve this is as follows –
-
-
- Start your app in a paused state:
- flutter run –start-paused …
- dart run –pause-isolates-on-start –observe …
- Open DevTools from the IDE where you started your app, or from the link that was printed to the command line if you started your app from the CLI.
- Navigate to the Network screen and ensure that the recording has started.
- Resume your app.
- The Network profiler will now record all network traffic from your app, including traffic from app startup.
- Start your app in a paused state:
-
- Logging – This tab shows logs from our application. By default the following logs are captured –
- Garbage collection events from the Dart runtime
- Flutter framework events, like frame creation events
- stdout and stderr from applications
Customs logs can be added to the application and they will be reflected here.
To learn more about the remaining Flutter Tools, please refer to – A Guide on Optimising and Improving your Flutter app performance by Using Flutter Dev Tools


